> ## Documentation Index
> Fetch the complete documentation index at: https://docs.supaboard.ai/llms.txt
> Use this file to discover all available pages before exploring further.
# Understand and refine answers
> Read the explanation, check the supporting data, and ask useful follow-up questions.
An answer can combine a written explanation with charts, tables, headline metrics, and generated artifacts. Start with the conclusion, then inspect the evidence that matters to your decision.
## Before you begin
[Ask the Analyst](/analyst/overview) a question using an agent with access to the relevant data. Include any specific definition or comparison you have in mind.
## Read the answer
1. Check the **scope**: the date range, filters, and groups included.
2. Check the **meaning**: what counts as revenue, an active customer, or another business metric.
3. Open the supporting **chart or table** to examine the numbers.
4. Look for **assumptions and missing information** before acting on the result.
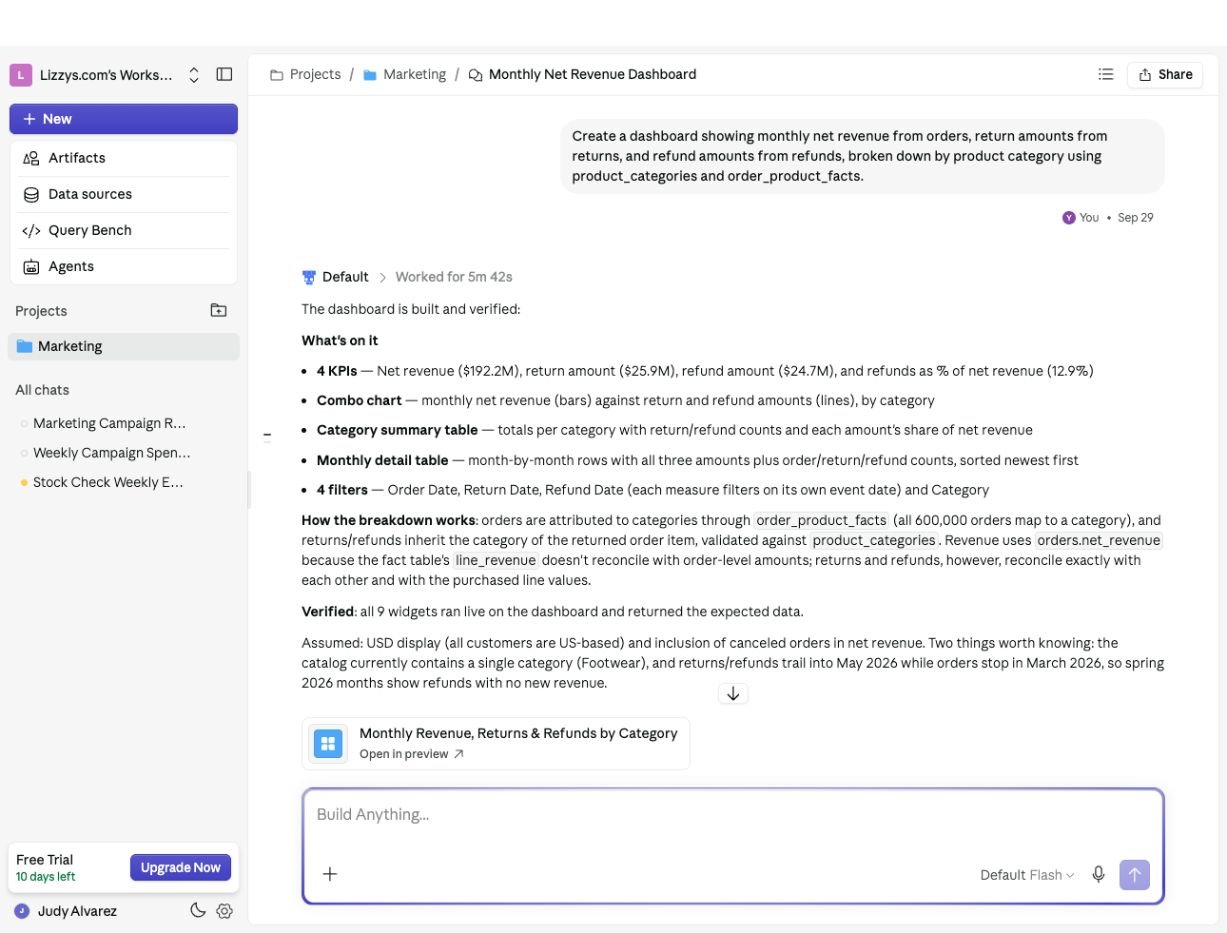 Ask follow-ups in the same chat: “Does revenue include refunds?” or “Show the same comparison for returning customers only.”
## Choose the right depth
The current modes are **Flash**, **Pro**, and **Max**. Flash suits everyday questions; Pro supports deeper analysis; Max plans before investigating complex tasks. Older guides refer to Concise and Deep Dive.
Request the detail you need in any mode: “Give me three key findings” or “Explain the drivers and show the supporting breakdowns.” A shorter explanation still needs the right data and definitions.
## Work with the result
* **Open** a visual or artifact for a closer look.
* Use a widget's **⋯** menu for actions such as downloading an image or exporting a table as CSV.
* Use **Pin** to reuse a widget in a dashboard or Datasite.
* Ask for a change in the same chat: “Use a line chart” or “Add a breakdown by channel.”
## Correct a result
Use **Dislike** on the affected widget and explain what was wrong when prompted—for example, “Exclude cancelled orders.” Use **Like** for a useful result.
If the issue is a business definition everyone should use, update the agent's [rules, knowledge, or verified queries](/agents/overview) to provide shared context for future questions.
## Next steps
You should now know what the answer covers and which data supports it. [Improve your next prompt](/analyst/interacting-with-ai), [create a report](/artifacts/reports-and-presentations), or [save the work in a project](/projects/overview).
This documentation is built and hosted on [Mintlify](https://mintlify.com), a developer documentation platform.
Ask follow-ups in the same chat: “Does revenue include refunds?” or “Show the same comparison for returning customers only.”
## Choose the right depth
The current modes are **Flash**, **Pro**, and **Max**. Flash suits everyday questions; Pro supports deeper analysis; Max plans before investigating complex tasks. Older guides refer to Concise and Deep Dive.
Request the detail you need in any mode: “Give me three key findings” or “Explain the drivers and show the supporting breakdowns.” A shorter explanation still needs the right data and definitions.
## Work with the result
* **Open** a visual or artifact for a closer look.
* Use a widget's **⋯** menu for actions such as downloading an image or exporting a table as CSV.
* Use **Pin** to reuse a widget in a dashboard or Datasite.
* Ask for a change in the same chat: “Use a line chart” or “Add a breakdown by channel.”
## Correct a result
Use **Dislike** on the affected widget and explain what was wrong when prompted—for example, “Exclude cancelled orders.” Use **Like** for a useful result.
If the issue is a business definition everyone should use, update the agent's [rules, knowledge, or verified queries](/agents/overview) to provide shared context for future questions.
## Next steps
You should now know what the answer covers and which data supports it. [Improve your next prompt](/analyst/interacting-with-ai), [create a report](/artifacts/reports-and-presentations), or [save the work in a project](/projects/overview).
This documentation is built and hosted on [Mintlify](https://mintlify.com), a developer documentation platform.