> ## Documentation Index
> Fetch the complete documentation index at: https://docs.supaboard.ai/llms.txt
> Use this file to discover all available pages before exploring further.
# Create your first dashboard
> Turn a business question into a dashboard, then check it before sharing.
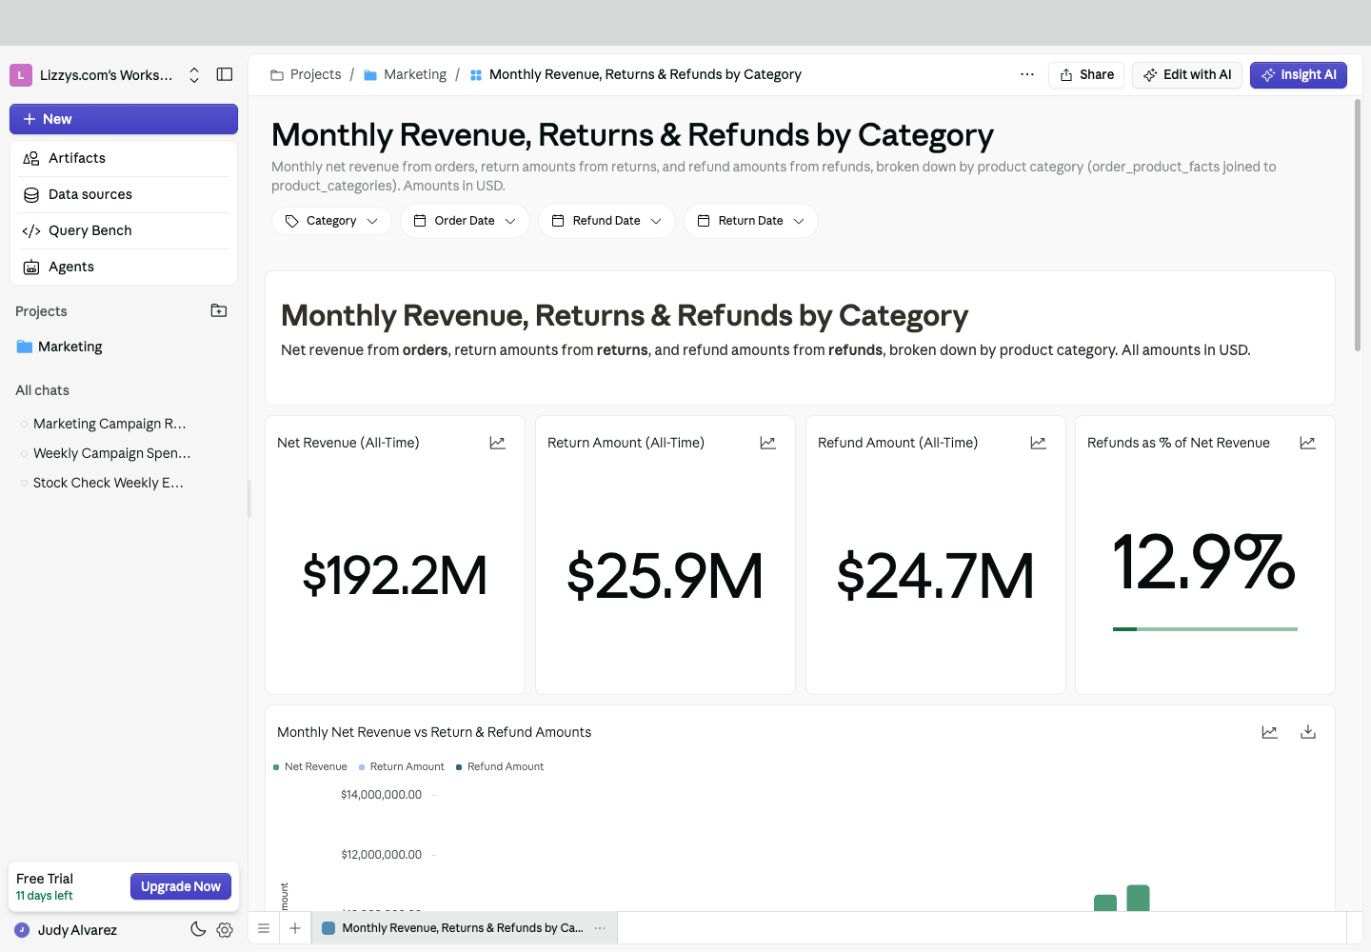
Build a dashboard for a question your team needs to answer repeatedly. This walkthrough uses a revenue review: headline numbers, a monthly trend, a category breakdown, and a date filter.
## Before you begin
* Your workspace needs a [connected data source](/data-sources/overview).
* Choose an agent that can read the relevant tables and understands your business definitions.
* You need permission to create dashboards. Adding to an existing dashboard needs **Can create** access and an editing role in the workspace.
## Start with a clear brief
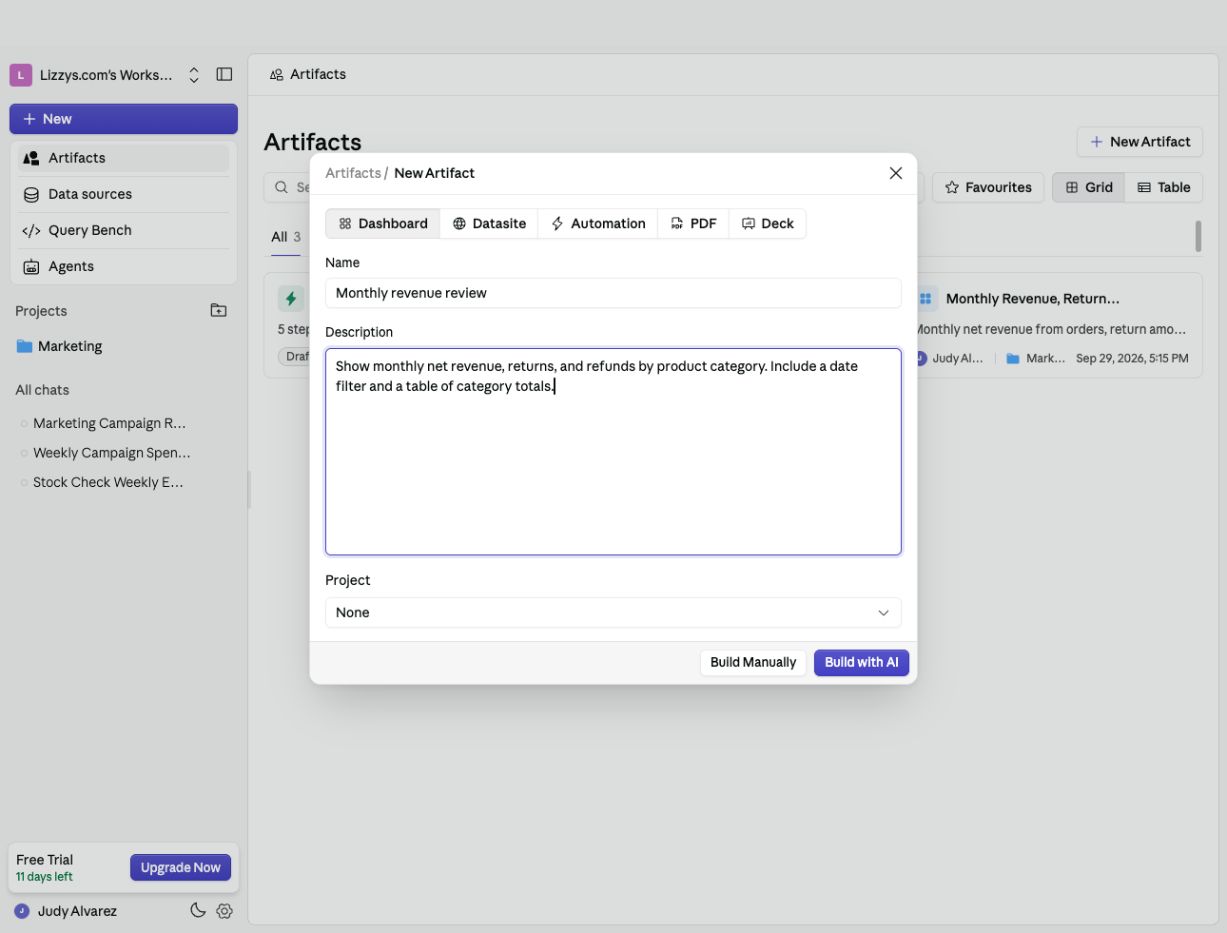
1. Open **Artifacts** in the sidebar and select **New Artifact**.
2. Choose **Dashboard** and enter a name people will recognize.
3. Describe the audience, metrics, period, and filters. Choose a project if the dashboard belongs with other work.
4. Select **Build with AI** to continue in the Analyst.
 Create a dashboard for our monthly revenue review. Show net revenue, return amounts, and refunds as headline metrics; compare them by month; and add a table by product category. Use USD. Add date filters and explain which date each metric uses. Ask me if the definition of net revenue is unclear.
You can also choose **Dashboard** beneath the Home message box, or ask for a dashboard in a chat that already contains your analysis.
## Review the result
Open the dashboard card in the conversation. Check one part at a time:
1. **Definitions:** does revenue include discounts, canceled orders, or refunds?
2. **Dates:** does each metric use the intended event date?
3. **Totals:** do the headline numbers agree with the supporting tables?
4. **Filters:** does changing a value affect the intended widgets?
5. **Readability:** can a teammate understand the page without reading the chat?
Ask for specific changes in the same conversation: “Move the three headline metrics to the top,” “Use completed orders only,” or “Add a note explaining the return-date filter.”
Create a dashboard for our monthly revenue review. Show net revenue, return amounts, and refunds as headline metrics; compare them by month; and add a table by product category. Use USD. Add date filters and explain which date each metric uses. Ask me if the definition of net revenue is unclear.
You can also choose **Dashboard** beneath the Home message box, or ask for a dashboard in a chat that already contains your analysis.
## Review the result
Open the dashboard card in the conversation. Check one part at a time:
1. **Definitions:** does revenue include discounts, canceled orders, or refunds?
2. **Dates:** does each metric use the intended event date?
3. **Totals:** do the headline numbers agree with the supporting tables?
4. **Filters:** does changing a value affect the intended widgets?
5. **Readability:** can a teammate understand the page without reading the chat?
Ask for specific changes in the same conversation: “Move the three headline metrics to the top,” “Use completed orders only,” or “Add a note explaining the return-date filter.”
 ## Build it manually instead
Choose **Build Manually** in the creation form. Use **Insert Chart**, **Insert Table**, or **Insert KPI** in the bottom toolbar, then select an existing result or describe the widget you need. Add text for definitions and [filters](/dashboards/filters/how-to-add-filters-to-your-dashboard) for the slices people will explore.
Follow [Add widgets and edit the layout](/dashboards/how-to/edit-a-dashboard) for the full editing and saving workflow.
## Expected result
The dashboard appears in **Artifacts → Dashboards** and in the selected project's **Artifacts** tab. You can reopen it and use its filters without editing its design.
## Next steps
[Check the data behind a number](/dashboards/how-to/explore-dashboard-data), then [share the dashboard](/dashboards/how-to/share-a-dashboard) with the right access level.
This documentation is built and hosted on [Mintlify](https://mintlify.com), a developer documentation platform.
## Build it manually instead
Choose **Build Manually** in the creation form. Use **Insert Chart**, **Insert Table**, or **Insert KPI** in the bottom toolbar, then select an existing result or describe the widget you need. Add text for definitions and [filters](/dashboards/filters/how-to-add-filters-to-your-dashboard) for the slices people will explore.
Follow [Add widgets and edit the layout](/dashboards/how-to/edit-a-dashboard) for the full editing and saving workflow.
## Expected result
The dashboard appears in **Artifacts → Dashboards** and in the selected project's **Artifacts** tab. You can reopen it and use its filters without editing its design.
## Next steps
[Check the data behind a number](/dashboards/how-to/explore-dashboard-data), then [share the dashboard](/dashboards/how-to/share-a-dashboard) with the right access level.
This documentation is built and hosted on [Mintlify](https://mintlify.com), a developer documentation platform.