> ## Documentation Index
> Fetch the complete documentation index at: https://docs.supaboard.ai/llms.txt
> Use this file to discover all available pages before exploring further.
# Add widgets and edit a dashboard
> Choose between AI changes and manual editing, then save and review your dashboard.
Use AI to describe a change, or use the editor to arrange widgets and adjust their appearance yourself. A widget is one item on the dashboard: a chart, table, headline metric, text block, image, or embed.
## Before you begin
Open the dashboard from **Artifacts → Dashboards**. You need **Can edit** access to change existing content or **Can create** to add widgets and pages. Changes also require an editing role in the workspace.
## Edit with AI
Select **Edit with AI** at the top of the dashboard. The dashboard opens alongside an Analyst conversation. Describe the change and review the result in the preview.
Be specific: “Keep the existing charts, add a KPI for completed orders, and put it beside net revenue.” For questions about the current numbers, use [Insight AI](/dashboards/insights-in-dashboard).
## Open the manual editor
1. Open **More options** (**⋯**) at the top of the dashboard.
2. Select **Edit manually**.
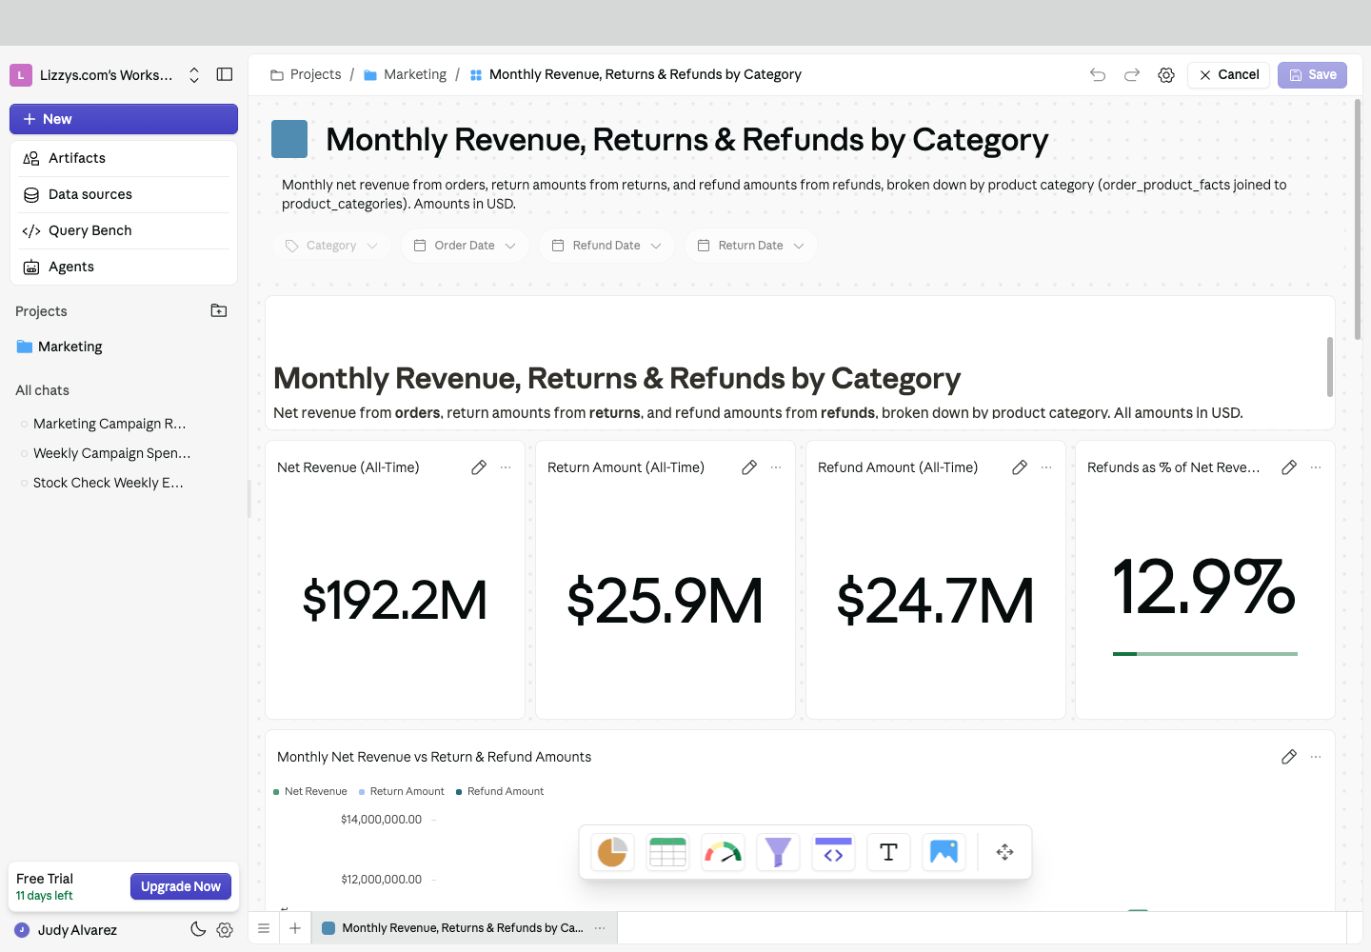
3. The toolbar changes to **Undo**, **Redo**, **Settings**, **Cancel**, and **Save**. The insert toolbar appears near the bottom of the canvas.
 ## Add a widget
Choose an insert control in the bottom toolbar. Hover over an icon to see its name.
| Choose | Use it for |
| - | - |
| **Insert Chart** | Trends and comparisons |
| **Insert Table** | Detailed rows or a summary by category |
| **Insert KPI** | A headline number, such as revenue or order count |
| **Insert Filter** | A control viewers use to narrow the data |
| **Insert Text** | Titles, definitions, and commentary |
| **Insert Picture** | An image from a file |
| **Insert Embed** | Content from a URL that allows embedding |
For a chart, table, or KPI, the placeholder lets you select an existing result from a collection or create one using a prompt. Choose the result that already has the right calculation; changing its appearance does not change what the metric means.
## Arrange and format
* Drag the widget's move handle on its left edge to reposition it.
* Drag its resize handle to change its size.
* Use the widget's pencil or settings control to change its chart, table, or KPI formatting.
* Use the widget's **⋯** menu for actions such as changing its colors, hiding its header, moving it to another page, or removing it.
* Use the dashboard's **Settings** for shared colors, fonts, spacing, and other page settings.
Start with the question readers need answered. Put the headline metrics first, then the chart that explains the change, then the detailed table.
## Save and check
1. Apply changes in any open widget settings panel.
2. Select **Save** in the dashboard toolbar to save the dashboard edits.
3. Check the result in view mode, including filters and any resized tables.
Use **Undo** and **Redo** while editing. **Cancel** abandons the current dashboard edits. If you navigate away with unsaved changes, review the save-or-discard prompt before leaving.
## Expected result
The saved layout and widget settings appear when you reopen the dashboard. Viewers can explore the data without seeing editing controls.
## Next steps
Configure [charts](/dashboards/widgets/chart-widget), [tables](/dashboards/widgets/table-widget), or [KPIs](/dashboards/widgets/kpi-widget), then [add dashboard filters](/dashboards/filters/how-to-add-filters-to-your-dashboard).
This documentation is built and hosted on [Mintlify](https://mintlify.com), a developer documentation platform.
## Add a widget
Choose an insert control in the bottom toolbar. Hover over an icon to see its name.
| Choose | Use it for |
| - | - |
| **Insert Chart** | Trends and comparisons |
| **Insert Table** | Detailed rows or a summary by category |
| **Insert KPI** | A headline number, such as revenue or order count |
| **Insert Filter** | A control viewers use to narrow the data |
| **Insert Text** | Titles, definitions, and commentary |
| **Insert Picture** | An image from a file |
| **Insert Embed** | Content from a URL that allows embedding |
For a chart, table, or KPI, the placeholder lets you select an existing result from a collection or create one using a prompt. Choose the result that already has the right calculation; changing its appearance does not change what the metric means.
## Arrange and format
* Drag the widget's move handle on its left edge to reposition it.
* Drag its resize handle to change its size.
* Use the widget's pencil or settings control to change its chart, table, or KPI formatting.
* Use the widget's **⋯** menu for actions such as changing its colors, hiding its header, moving it to another page, or removing it.
* Use the dashboard's **Settings** for shared colors, fonts, spacing, and other page settings.
Start with the question readers need answered. Put the headline metrics first, then the chart that explains the change, then the detailed table.
## Save and check
1. Apply changes in any open widget settings panel.
2. Select **Save** in the dashboard toolbar to save the dashboard edits.
3. Check the result in view mode, including filters and any resized tables.
Use **Undo** and **Redo** while editing. **Cancel** abandons the current dashboard edits. If you navigate away with unsaved changes, review the save-or-discard prompt before leaving.
## Expected result
The saved layout and widget settings appear when you reopen the dashboard. Viewers can explore the data without seeing editing controls.
## Next steps
Configure [charts](/dashboards/widgets/chart-widget), [tables](/dashboards/widgets/table-widget), or [KPIs](/dashboards/widgets/kpi-widget), then [add dashboard filters](/dashboards/filters/how-to-add-filters-to-your-dashboard).
This documentation is built and hosted on [Mintlify](https://mintlify.com), a developer documentation platform.