> ## Documentation Index
> Fetch the complete documentation index at: https://docs.supaboard.ai/llms.txt
> Use this file to discover all available pages before exploring further.
# Export a dashboard or create a report
> Choose a dashboard snapshot, an AI-written report, a chart image, or a table export.
Choose the output that matches what your audience needs. A snapshot captures the dashboard as it looks; a report adds an AI-written explanation around the data.
## Before you begin
Open the intended dashboard page and check the data, period, and filters. Generating an AI report requires **Can chat** access or higher. Available actions also depend on your workspace permissions.
## Choose the output
| Output | Where to start |
| - | - |
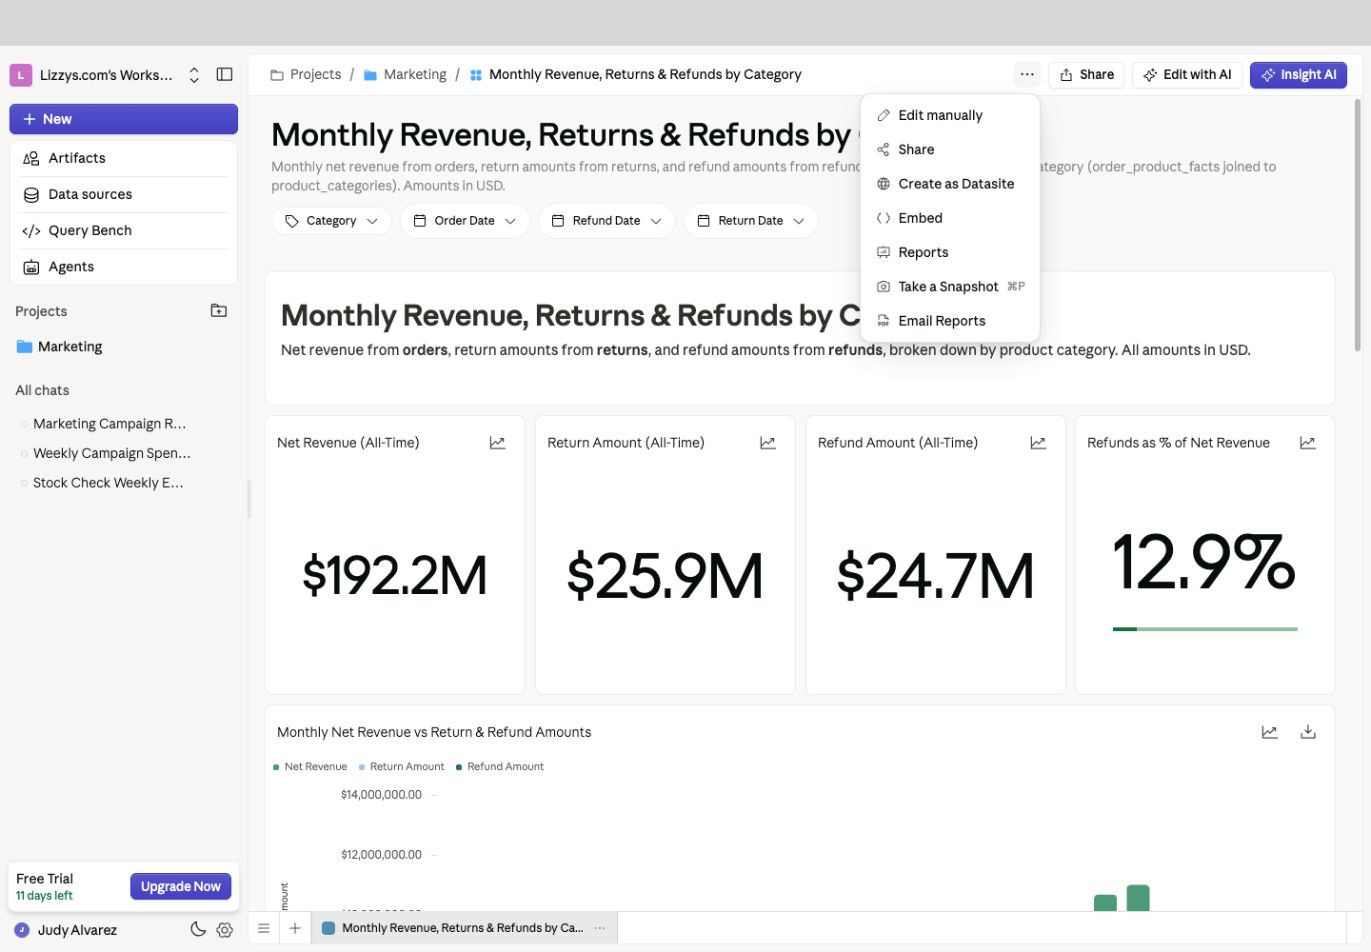
| PDF of the dashboard's current appearance | **More options → Take a Snapshot** |
| PDF or PowerPoint with an AI-written narrative | **More options → Reports → New Report** |
| Image of one chart | The chart's **Export as PNG** control |
| Data from one table | The table's **Export as CSV** control |
| Recurring email delivery | **More options → Email Reports** |
 ## Take a snapshot
1. Set the dashboard filters to the view you want to share.
2. Select **More options → Take a Snapshot**.
3. Wait for the snapshot to finish, then choose **Download**.
4. Open the PDF and check that the intended page and data slice were captured.
## Create an AI report
1. Select **More options → Reports**, then **New Report**.
2. Choose the dashboard page and enter a **Report Title**.
3. Choose **PDF** or **PPT** in **Report Type**.
4. Review **Filters** in the report form. Set the intended data slice explicitly.
5. Use **Custom Instruction for AI** to describe the audience, questions, and structure.
6. Optionally use **Advanced Settings** for page-by-page guidance.
7. Select **Create Report**, wait for generation, then open and review the file.
## Take a snapshot
1. Set the dashboard filters to the view you want to share.
2. Select **More options → Take a Snapshot**.
3. Wait for the snapshot to finish, then choose **Download**.
4. Open the PDF and check that the intended page and data slice were captured.
## Create an AI report
1. Select **More options → Reports**, then **New Report**.
2. Choose the dashboard page and enter a **Report Title**.
3. Choose **PDF** or **PPT** in **Report Type**.
4. Review **Filters** in the report form. Set the intended data slice explicitly.
5. Use **Custom Instruction for AI** to describe the audience, questions, and structure.
6. Optionally use **Advanced Settings** for page-by-page guidance.
7. Select **Create Report**, wait for generation, then open and review the file.
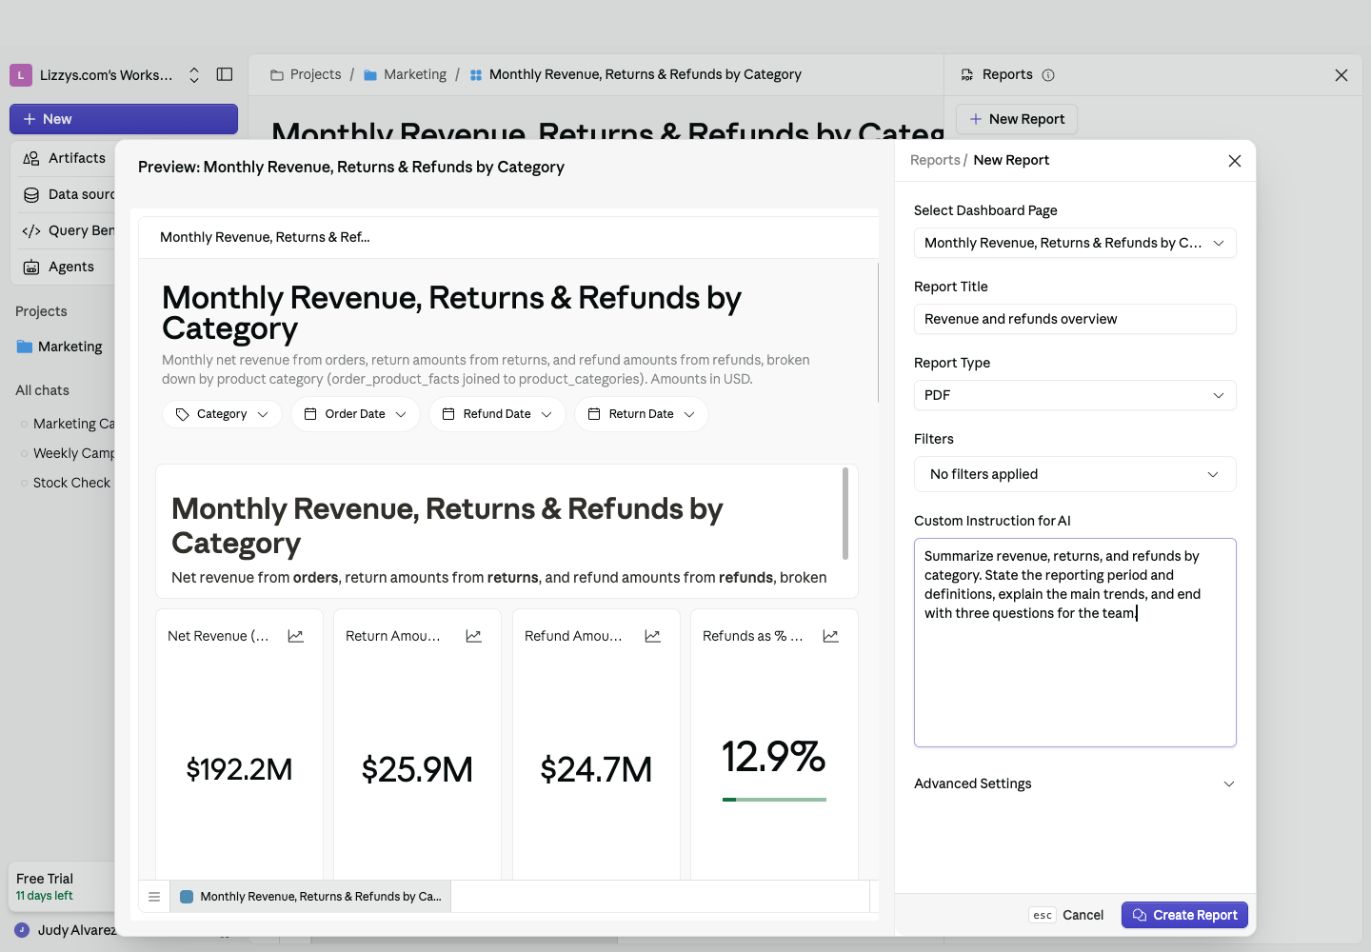 For example: “Prepare a concise business review. State the reporting period, explain the biggest changes, and end with three questions for the team.” Avoid asking for a conclusion that the data has not established.
Reports remain available from the dashboard's **Reports** panel so you can download them again.
## Expected result
You have a downloaded file that matches the intended dashboard, period, and audience. Check figures and formatting before sharing it.
## Next steps
For a report assembled from several sources or an existing analysis, use [Reports and presentations](/artifacts/reports-and-presentations). For repeated delivery, follow [Schedule a dashboard report](/automations/schedule-dashboard-reports).
This documentation is built and hosted on [Mintlify](https://mintlify.com), a developer documentation platform.
For example: “Prepare a concise business review. State the reporting period, explain the biggest changes, and end with three questions for the team.” Avoid asking for a conclusion that the data has not established.
Reports remain available from the dashboard's **Reports** panel so you can download them again.
## Expected result
You have a downloaded file that matches the intended dashboard, period, and audience. Check figures and formatting before sharing it.
## Next steps
For a report assembled from several sources or an existing analysis, use [Reports and presentations](/artifacts/reports-and-presentations). For repeated delivery, follow [Schedule a dashboard report](/automations/schedule-dashboard-reports).
This documentation is built and hosted on [Mintlify](https://mintlify.com), a developer documentation platform.