> ## Documentation Index
> Fetch the complete documentation index at: https://docs.supaboard.ai/llms.txt
> Use this file to discover all available pages before exploring further.
# Ask your first question
> Go from a connected workspace to your first answer, then build on it.
Start with a question you would normally ask a colleague, such as “What changed in revenue last month?” The Analyst helps you investigate and turn the result into something useful.
## Before you begin
* [Sign up for Supaboard](https://auth.supaboard.ai/onboard/register) or accept your team's workspace invitation.
* Check that the workspace has a [data source](/data-sources/overview). If you're joining an existing team, this may already be done.
* Use an agent that can access the data you need. Ask your workspace administrator for access if the agent or data is unavailable.
You can use your workspace's default agent. Creating your own agent is optional.
 ## Ask your first question
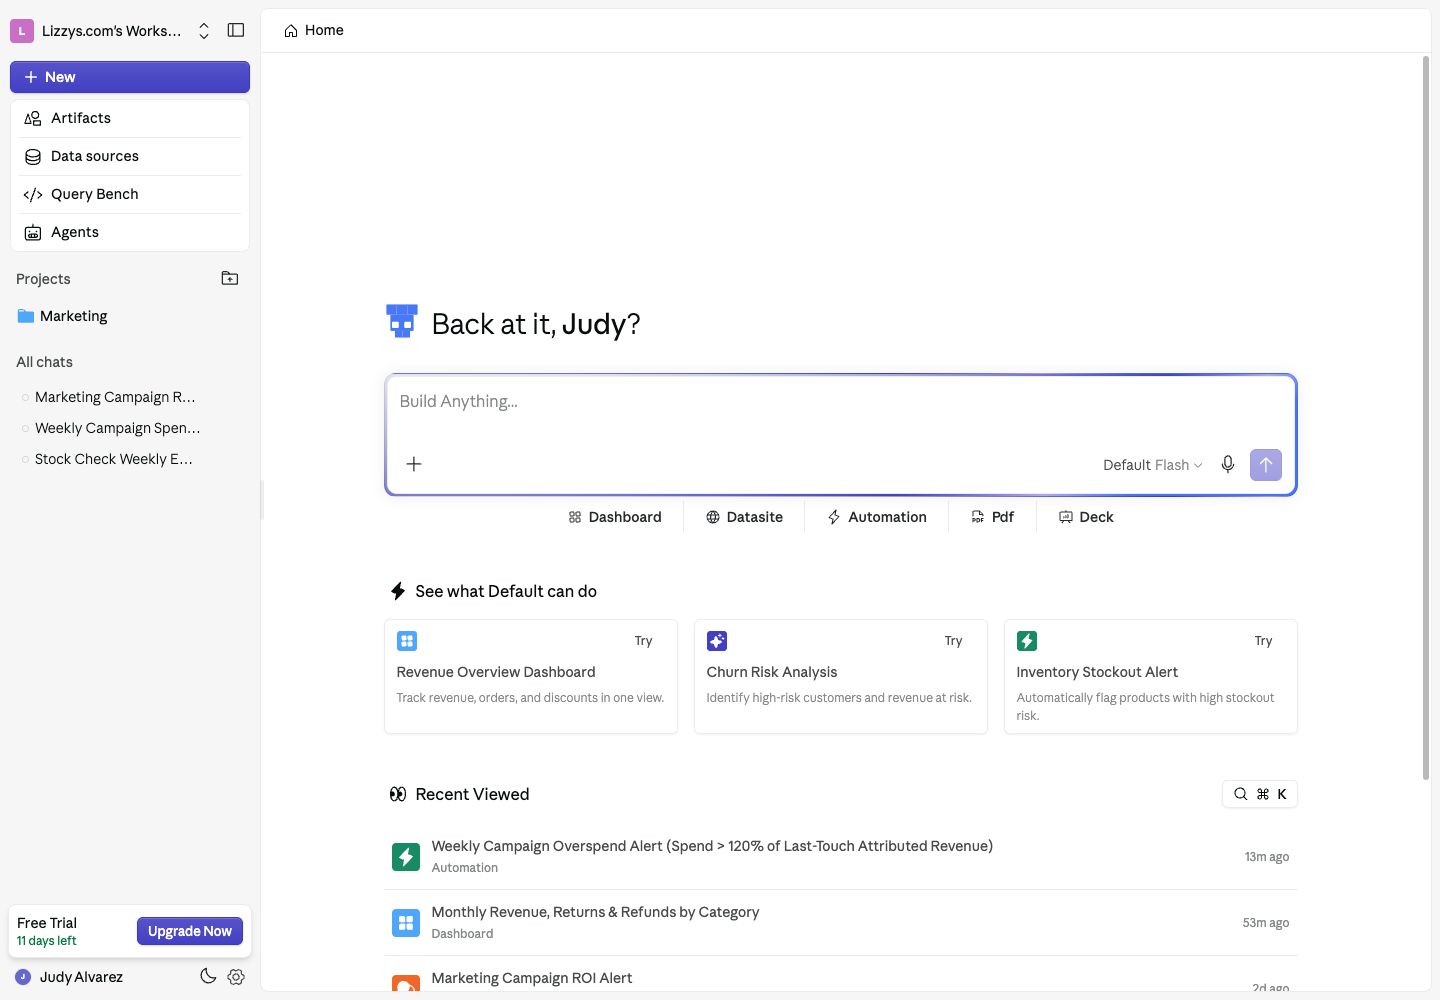
1. Open **Home**, or click **New** in the sidebar to start a chat.
2. Choose an agent in the message box. Start with **Flash** for an everyday question.
3. Type a question and send it. Include the metric, period, and comparison you care about.
What data can you access, and what business questions could we answer with it?
For a more specific first question, try: “Compare revenue last month with the previous month. Show which products contributed most to the change.”
## Read and refine the answer
The answer can include an explanation, charts, tables, or headline metrics. Check the date range and definitions, then ask a follow-up in the same chat: “Break that down by region” or “Use completed orders only.”
Use **Pro** for deeper analysis or **Max** for a complex task that benefits from a plan before investigation. Add files or existing artifacts as context when the Analyst needs more information. See [Ask the Analyst](/analyst/overview).
## Turn the answer into an output
Ask “Create a dashboard from this analysis” or “Make a presentation for our weekly review.” Open the resulting artifact card to review it and request changes in the same chat.
You can also open **Artifacts → New Artifact**, choose an output, and use **Build with AI**. Dashboards, Datasites, and automations also offer **Build Manually**.
After this walkthrough, you should have a chat you can return to and an answer you can inspect. Find any outputs you created in [Artifacts](/artifacts/overview).
## Create your first agent
When your team needs consistent definitions or a particular data scope, open **Agents** and configure an agent for that purpose. Add the relevant data sources, business rules, and knowledge. See [Set up agents](/agents/overview).
## Next steps
* [Write more effective questions](/analyst/interacting-with-ai).
* [Keep related work in a project](/projects/overview).
* [Build and share a dashboard](/dashboards/how-to/create-a-dashboard).
This documentation is built and hosted on [Mintlify](https://mintlify.com), a developer documentation platform.
## Ask your first question
1. Open **Home**, or click **New** in the sidebar to start a chat.
2. Choose an agent in the message box. Start with **Flash** for an everyday question.
3. Type a question and send it. Include the metric, period, and comparison you care about.
What data can you access, and what business questions could we answer with it?
For a more specific first question, try: “Compare revenue last month with the previous month. Show which products contributed most to the change.”
## Read and refine the answer
The answer can include an explanation, charts, tables, or headline metrics. Check the date range and definitions, then ask a follow-up in the same chat: “Break that down by region” or “Use completed orders only.”
Use **Pro** for deeper analysis or **Max** for a complex task that benefits from a plan before investigation. Add files or existing artifacts as context when the Analyst needs more information. See [Ask the Analyst](/analyst/overview).
## Turn the answer into an output
Ask “Create a dashboard from this analysis” or “Make a presentation for our weekly review.” Open the resulting artifact card to review it and request changes in the same chat.
You can also open **Artifacts → New Artifact**, choose an output, and use **Build with AI**. Dashboards, Datasites, and automations also offer **Build Manually**.
After this walkthrough, you should have a chat you can return to and an answer you can inspect. Find any outputs you created in [Artifacts](/artifacts/overview).
## Create your first agent
When your team needs consistent definitions or a particular data scope, open **Agents** and configure an agent for that purpose. Add the relevant data sources, business rules, and knowledge. See [Set up agents](/agents/overview).
## Next steps
* [Write more effective questions](/analyst/interacting-with-ai).
* [Keep related work in a project](/projects/overview).
* [Build and share a dashboard](/dashboards/how-to/create-a-dashboard).
This documentation is built and hosted on [Mintlify](https://mintlify.com), a developer documentation platform.