> ## Documentation Index
> Fetch the complete documentation index at: https://docs.supaboard.ai/llms.txt
> Use this file to discover all available pages before exploring further.
> Write, run, save, and organize queries against your connected data.
# Query Bench
**Query Bench** is a code-first workspace for writing, running, and saving queries against your connected data sources. The Analyst answers questions in natural language; Query Bench gives you direct control over the query itself, with a full code editor, schema-aware autocomplete, AI tab completion, and a conversational assistant that can write or fix queries on demand.
Results can be displayed as a table, chart, or KPI. Save queries for reuse and pin a result to a dashboard you can add content to.
## Before you begin
You need Query Bench feature access and an active data source you can use. Start with [Create and save a query](/query-bench/create-and-save-a-query) for a complete walkthrough.
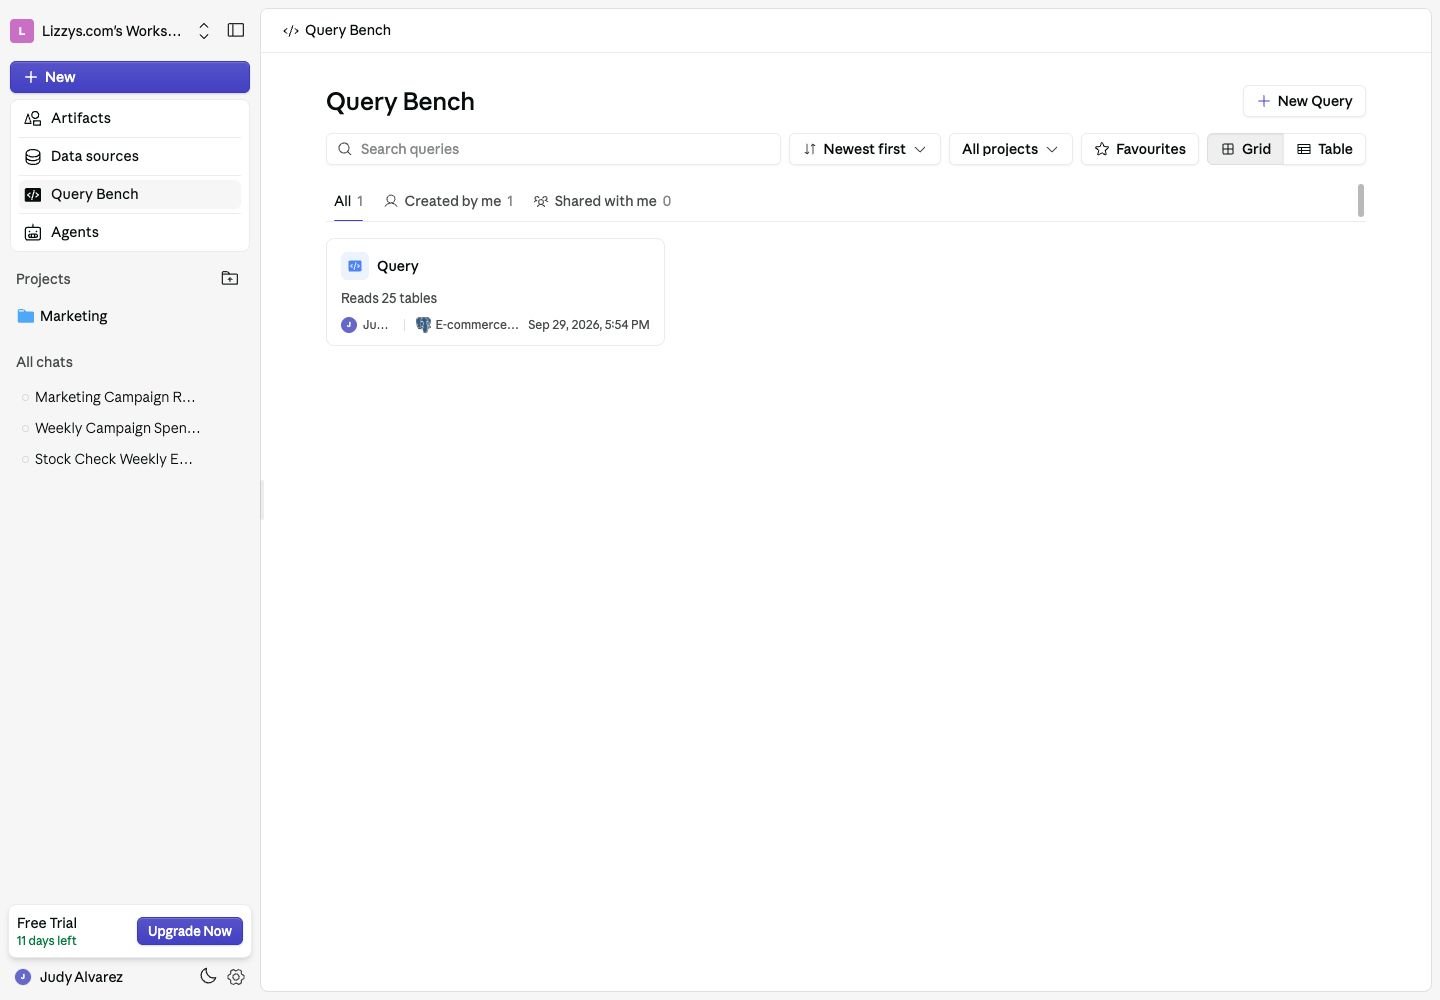 ## The Query Bench Home
Navigate to **Query Bench** in the sidebar to see all saved queries in your workspace.
### Display modes
Toggle between **Grid** and **Table** views. Your preference is saved.
**Table view columns:**
| Column | Description |
| - | - |
| **Name** | Query title |
| **Sources** | The data sources the query reads |
| **Owner** | Who created the query |
| **Project** | Where the query is organized |
| **Created** | When the query was written |
| **Actions** | Rename and Delete |
### Search
Search the loaded queries by title. Use project, ownership, and favorite filters to narrow the list, and load more results when available.
Click any query to open it in the editor.
## Creating a Query
Click **New Query** to open the **Create New Query** modal.
| Field | Required | Notes |
| - | - | - |
| **Enter Query Name** | Yes | A descriptive title — shown in the home list and when pinned to dashboards |
| **Select Data Source** | Yes (at least one) | The connections this query runs against. Inactive connections cannot be selected. |
| **Select Query Language** | Yes | The language you'll write in (see below) |
### Query languages
| Language | When to use |
| - | - |
| **Native Query Language** | SQL (PostgreSQL, MySQL, Redshift, and so on) or your database's own query syntax. Auto-detected from the connected data source. For MongoDB this means aggregation pipelines — see [MongoDB queries](#mongodb-queries). |
| **Python** | Query one or more data sources, transform data, or combine results across databases. Requires the Python runner feature — see [Python and multi-source queries](#python-and-multi-source-queries). |
Once created, the editor opens immediately.
## The Editor
The editor is a split-pane workspace with a right rail:
* **Top pane** — the code editor
* **Bottom pane** — results as a table, chart, or KPI
* **Right rail** — **Schema**, **Assistant**, and **History** tabs
Drag the divider to resize the panes. Before your first run the editor takes almost the whole height; after a successful run the results pane sizes itself to the number of rows returned, between 15% and 50% of the height.
### The editor header
| Control | What it does |
| - | - |
| **←** | Back to the Query Bench home |
| Query title | The current query's name |
| **You have unsaved changes** | Appears whenever the editor has edits you haven't saved |
| **Editor settings** (gear) | See [Editor settings](#editor-settings) |
| Right-rail button | Reopens the Schema/Assistant rail if you've closed it |
### Running and saving
These are two separate actions:
| Button | Shortcut | Behaviour |
| - | - | - |
| **Save** | `⌘S` / `Ctrl+S` | Only appears when you have unsaved changes |
| **Run Query** | `⌘↵` / `Ctrl+Enter` | Runs the query **and** saves it |
### Code editor features
**Syntax highlighting** for SQL, Python, and the other supported languages.
**Placeholder** — when the editor is empty it reads *"Start typing or ✨ Generate with Query Assistant"*. For languages with a starter snippet it reads *"Start with `` or ✨ Generate with Query Assistant"* — the snippet is clickable and seeds the editor with it.
## Autocomplete
Two different systems work side by side.
### Schema autocomplete
As you type, suggestions appear grouped into labelled sections, ranked by relevance:
| Section | What it contains |
| - | - |
| **Keywords** | SQL keywords and common functions — `SELECT`, `GROUP BY`, `OVER`, `PARTITION BY`, `DATE_TRUNC`, `COALESCE`, `ROW_NUMBER`, and the rest |
| **In query** | Symbols you defined further up in this query — CTEs, table aliases, column aliases |
| **Databases** | Databases from your connected data sources |
| **Tables** | Tables within those databases |
| **Columns** | Actual column names and types, fetched from your connections |
Ranking is cursor-aware: tables in the database you're currently querying are boosted above the rest. After typing a `.` the list switches to bare names and drops keywords entirely.
### AI tab completion
Beyond the suggestion list, the editor offers whole-completion **ghost text** — a greyed-out continuation of the line you're writing, generated by AI from your schema, your SQL dialect, and the code on both sides of your cursor.
| Key | Action |
| - | - |
| `Tab` | Accept the whole suggestion |
| `⌘Tab` / `Ctrl+Tab` | Accept one word |
| `Escape` | Dismiss |
Typing along with a suggestion advances the ghost text rather than requesting a new one, so it stays out of your way while you type. Ten SQL dialects are supported, plus a dedicated Python path.
> Tab completion can be switched off in **Editor settings → Tab Completion** if you'd rather use `Tab` for indentation.
## Editor Settings
Click the gear (**Editor settings**) in the editor header.
| Setting | Notes |
| - | - |
| **Title** | Rename the query inline, without leaving the editor |
| **Vim Mode** | Vim keybindings in the editor. A mode badge appears in the header when on. |
| **Relative Line Numbers** | Only shown while Vim Mode is on |
| **Highlight Current Line** | Only shown while Vim Mode is on |
| **Tab Completion** | Turns [AI tab completion](#ai-tab-completion) on or off |
| **Theme** | Editor colour scheme (below) |
### Themes
**System** · **Midnight** · **Daylight** · **VS Code Dark+** · **VS Code Light+** · **Dracula** · **Monokai**
**System** follows your Supaboard light/dark setting.
## Viewing Results
Results appear in the bottom pane. Switch format with the tabs above them.
### Table
A paginated, scrollable grid.
* Default page size: 50 rows
* Column headers with data-type metadata
* Export to **CSV**
* Pin to a dashboard as a Table widget
### Chart
An interactive visualisation.
* 28 chart types, from bar and line through sankey, sunburst and map — the full list is on [Chart Widget](/dashboards/widgets/chart-widget)
* Click **Edit** to change chart type, colours, axes, and legend
* Theme-aware colours (adjusts for light/dark automatically)
* Pin to a dashboard as a Chart widget
> The picker only offers chart types your current result shape can actually render, so you will usually see fewer than 28 tiles. Return two measures and grouped variants appear; return one and they don't.
### KPI
A single computed metric.
| Display style | Description |
| - | - |
| **Numeric** | A large formatted number — e.g. *1,234,567* |
| **Percentage** | A value expressed as a percentage — e.g. *85%* |
| **Trend** | A value with a directional indicator — e.g. *+12%* |
Pin to a dashboard as a KPI widget.
## Query Assistant
The **Assistant** tab in the right rail is a chat panel that reads your connected schemas and the code currently in the editor, then writes or fixes queries for you. The rail opens automatically the first time you open a query; if you close it, reopen it from the editor header.
### What it does
Type a request in plain English:
* *"Show me the top 10 customers by revenue in the last 90 days"*
* *"Add a filter for status = 'active'"*
* *"Rewrite this to group by month instead of day"*
* *"This query is slow — can you optimise it?"*
It also answers questions without touching your code. Asking *"what does this CTE do?"* gets an explanation, not an edit — the assistant routes your intent to writing, fixing, explaining, or summarising as appropriate.
### Reviewing changes
When the assistant modifies your query the editor switches to **diff mode**, showing your original alongside the suggestion.
* **Per-hunk** — accept or reject each changed block individually
* **All at once** — a floating bar reads *"Accept all changes?"* with **Reject all** (`⌘N` / `Ctrl+N`) and **Accept** (`⌘Y` / `Ctrl+Y`)
A single reply can propose **several** separate changes; those appear as a carousel you can page through. Both sides are formatted before diffing, so you see real hunks rather than one giant block.
You cannot type in the editor until every hunk is resolved — the assistant's input reads *"Accept or reject the change to continue…"* while a diff is open.
### Error fixing
When a query fails, the error appears in the results pane with a **"Fix this error with AI"** button. Clicking it sends the error to the assistant, which diagnoses it and suggests corrected code.
### Conversations
Assistant conversations are **saved**. The header of the assistant panel is a session switcher:
* **New conversation** starts a fresh thread
* **Recent** lists your previous threads for this query — unnamed ones show as *"Untitled session"*
Each turn carries the recent history forward, so follow-ups like *"now do the same for last quarter"* work as expected. Sessions persist across page reloads and across visits.
## History and Undo
The **History** tab in the right rail records versions of your query as you work, so you can compare and roll back.
### Versions
A version is recorded at each of these moments, and the list shows where each one came from:
| Tag | Recorded when |
| - | - |
| `load` | The query as it was when you opened it — your permanent way back to the starting point |
| `run` | You pressed **Run Query** |
| `save` | You pressed **Save** |
| `ai` | You accepted an assistant diff |
Each row shows a relative timestamp and a `+N −N` count of lines changed; the version matching the editor is labelled **Current**.
* **Hover** a version to preview it as a diff overlaid on the editor — nothing changes until you click
* **Click** a version to apply it
Up to 50 versions are kept per query. History lives in your browser session, so it survives a page reload but doesn't follow you to another device.
### Undo and redo
The header of the History panel has **Undo** and **Redo** buttons, and the standard shortcuts work anywhere on the page:
| Action | Mac | Windows / Linux |
| - | - | - |
| Undo | `⌘Z` | `Ctrl+Z` |
| Redo | `⇧⌘Z` | `Ctrl+Shift+Z` or `Ctrl+Y` |
Undo covers edits to the code itself — including applied AI diffs and history versions — not schema selections or panel state. The undo stack is also preserved across reloads, so `⌘Z` still works after you come back.
## Schema Browser
The **Schema** tab in the right rail shows the structure of every data source available to this query.
### What you can browse
* **Data sources** — expandable list of connected databases
* **Tables** — expand any database to see its tables
* **Columns** — expand any table to see its columns
### Search
Filter by resource, table, or column name using the search bar in the panel.
The schema browser reflects the same tables and columns used by autocomplete in the editor — use it as a reference while writing. After you refresh a table's schema from Data Sources, the change applies here and in autocomplete **immediately**; there is no cache to wait out.
## MongoDB Queries
For MongoDB data sources, the assistant writes real **aggregation pipelines** — a JSON array of stages, not a query string.
Two things worth knowing:
* **Read-only.** Generated pipelines never use `$out` or `$merge`.
* **Dates must be Extended JSON.** A date compared as a plain string silently matches **zero** documents rather than erroring. Generated pipelines use the `{"$date": ...}` form; if you hand-edit one, keep it.
Mongo pipelines are validated by actually running them before the assistant shows you the result.
## Python and Multi-Source Queries
> **Feature-gated.** Python and multi-source selection require the Python runner feature. Without it, the language dropdown disables Python and the data-source picker caps you at one source. See [pricing](https://supaboard.ai/pricing).
### Python as the query language
Write Python instead of SQL when you need to:
* Transform or reshape data after retrieval
* Combine results from multiple sources with logic that's awkward in SQL
* Run calculations that are difficult to express in SQL
The editor loads a full Python language mode, and tab completion switches to a Python-aware model.
#### The runtime contract
Python queries run in a constrained sandbox, and generated code follows the same rules:
| Rule | Detail |
| - | - |
| **Connection** | A single `Connection` object is provided |
| **Querying** | `conn.run(...)` returns a list of dicts |
| **Allowed** | `numpy` |
| **Not allowed** | `try` / `except` / `finally`; Pydantic, Query or Data classes; direct database drivers such as `pymongo` or `asyncpg` |
Python snippets are not execution-validated before they are shown to you, so run them yourself before saving.
### Multi-source queries
Select more than one data source when creating a query. Multi-source is **Python only** — Python is the glue that joins or merges data across separate databases.
## Pinning Results to a Dashboard
Any result — table, chart, or KPI — can be pinned directly from the results pane.
Click **Pin to Dashboard** above the results, then select an existing dashboard or create one inline. The widget is added immediately and re-runs the underlying query on every dashboard load.
Pinned widgets keep their full configuration — query code, data source mapping, chart type, KPI display style — so they stay accurate as your data changes.
## Managing Saved Queries
### Rename
Either from the Query Bench home — action menu (three dots) → **Rename** — or inline from **Editor settings → Title** while the query is open.
### Delete
Action menu → **Delete**. A confirmation is required. Deleting a query does not remove dashboard widgets pinned from it — those keep working independently.
### Returning to a query
Click any query from the home list. The last saved code, output format, and assistant conversations are all restored.
## Permissions
Query Bench feature access, data source access, and the saved query's sharing settings all apply.
| Access | What it allows |
| - | - |
| **Can view** | Run the saved query, inspect its results, and set variables for your own run |
| **Can edit** | Also change its query and variables, manually or with the Assistant |
| **Owner** | Also rename, share, or delete the query |
Changes require an editing role in the workspace. Python and multi-source queries also require the corresponding feature. Pinning a result requires permission to add content to the destination.
## Next steps
[Create a query](/query-bench/create-and-save-a-query) or explore [SQL examples](/query-bench/writing-sql-queries).
This documentation is built and hosted on [Mintlify](https://mintlify.com), a developer documentation platform.
## The Query Bench Home
Navigate to **Query Bench** in the sidebar to see all saved queries in your workspace.
### Display modes
Toggle between **Grid** and **Table** views. Your preference is saved.
**Table view columns:**
| Column | Description |
| - | - |
| **Name** | Query title |
| **Sources** | The data sources the query reads |
| **Owner** | Who created the query |
| **Project** | Where the query is organized |
| **Created** | When the query was written |
| **Actions** | Rename and Delete |
### Search
Search the loaded queries by title. Use project, ownership, and favorite filters to narrow the list, and load more results when available.
Click any query to open it in the editor.
## Creating a Query
Click **New Query** to open the **Create New Query** modal.
| Field | Required | Notes |
| - | - | - |
| **Enter Query Name** | Yes | A descriptive title — shown in the home list and when pinned to dashboards |
| **Select Data Source** | Yes (at least one) | The connections this query runs against. Inactive connections cannot be selected. |
| **Select Query Language** | Yes | The language you'll write in (see below) |
### Query languages
| Language | When to use |
| - | - |
| **Native Query Language** | SQL (PostgreSQL, MySQL, Redshift, and so on) or your database's own query syntax. Auto-detected from the connected data source. For MongoDB this means aggregation pipelines — see [MongoDB queries](#mongodb-queries). |
| **Python** | Query one or more data sources, transform data, or combine results across databases. Requires the Python runner feature — see [Python and multi-source queries](#python-and-multi-source-queries). |
Once created, the editor opens immediately.
## The Editor
The editor is a split-pane workspace with a right rail:
* **Top pane** — the code editor
* **Bottom pane** — results as a table, chart, or KPI
* **Right rail** — **Schema**, **Assistant**, and **History** tabs
Drag the divider to resize the panes. Before your first run the editor takes almost the whole height; after a successful run the results pane sizes itself to the number of rows returned, between 15% and 50% of the height.
### The editor header
| Control | What it does |
| - | - |
| **←** | Back to the Query Bench home |
| Query title | The current query's name |
| **You have unsaved changes** | Appears whenever the editor has edits you haven't saved |
| **Editor settings** (gear) | See [Editor settings](#editor-settings) |
| Right-rail button | Reopens the Schema/Assistant rail if you've closed it |
### Running and saving
These are two separate actions:
| Button | Shortcut | Behaviour |
| - | - | - |
| **Save** | `⌘S` / `Ctrl+S` | Only appears when you have unsaved changes |
| **Run Query** | `⌘↵` / `Ctrl+Enter` | Runs the query **and** saves it |
### Code editor features
**Syntax highlighting** for SQL, Python, and the other supported languages.
**Placeholder** — when the editor is empty it reads *"Start typing or ✨ Generate with Query Assistant"*. For languages with a starter snippet it reads *"Start with `` or ✨ Generate with Query Assistant"* — the snippet is clickable and seeds the editor with it.
## Autocomplete
Two different systems work side by side.
### Schema autocomplete
As you type, suggestions appear grouped into labelled sections, ranked by relevance:
| Section | What it contains |
| - | - |
| **Keywords** | SQL keywords and common functions — `SELECT`, `GROUP BY`, `OVER`, `PARTITION BY`, `DATE_TRUNC`, `COALESCE`, `ROW_NUMBER`, and the rest |
| **In query** | Symbols you defined further up in this query — CTEs, table aliases, column aliases |
| **Databases** | Databases from your connected data sources |
| **Tables** | Tables within those databases |
| **Columns** | Actual column names and types, fetched from your connections |
Ranking is cursor-aware: tables in the database you're currently querying are boosted above the rest. After typing a `.` the list switches to bare names and drops keywords entirely.
### AI tab completion
Beyond the suggestion list, the editor offers whole-completion **ghost text** — a greyed-out continuation of the line you're writing, generated by AI from your schema, your SQL dialect, and the code on both sides of your cursor.
| Key | Action |
| - | - |
| `Tab` | Accept the whole suggestion |
| `⌘Tab` / `Ctrl+Tab` | Accept one word |
| `Escape` | Dismiss |
Typing along with a suggestion advances the ghost text rather than requesting a new one, so it stays out of your way while you type. Ten SQL dialects are supported, plus a dedicated Python path.
> Tab completion can be switched off in **Editor settings → Tab Completion** if you'd rather use `Tab` for indentation.
## Editor Settings
Click the gear (**Editor settings**) in the editor header.
| Setting | Notes |
| - | - |
| **Title** | Rename the query inline, without leaving the editor |
| **Vim Mode** | Vim keybindings in the editor. A mode badge appears in the header when on. |
| **Relative Line Numbers** | Only shown while Vim Mode is on |
| **Highlight Current Line** | Only shown while Vim Mode is on |
| **Tab Completion** | Turns [AI tab completion](#ai-tab-completion) on or off |
| **Theme** | Editor colour scheme (below) |
### Themes
**System** · **Midnight** · **Daylight** · **VS Code Dark+** · **VS Code Light+** · **Dracula** · **Monokai**
**System** follows your Supaboard light/dark setting.
## Viewing Results
Results appear in the bottom pane. Switch format with the tabs above them.
### Table
A paginated, scrollable grid.
* Default page size: 50 rows
* Column headers with data-type metadata
* Export to **CSV**
* Pin to a dashboard as a Table widget
### Chart
An interactive visualisation.
* 28 chart types, from bar and line through sankey, sunburst and map — the full list is on [Chart Widget](/dashboards/widgets/chart-widget)
* Click **Edit** to change chart type, colours, axes, and legend
* Theme-aware colours (adjusts for light/dark automatically)
* Pin to a dashboard as a Chart widget
> The picker only offers chart types your current result shape can actually render, so you will usually see fewer than 28 tiles. Return two measures and grouped variants appear; return one and they don't.
### KPI
A single computed metric.
| Display style | Description |
| - | - |
| **Numeric** | A large formatted number — e.g. *1,234,567* |
| **Percentage** | A value expressed as a percentage — e.g. *85%* |
| **Trend** | A value with a directional indicator — e.g. *+12%* |
Pin to a dashboard as a KPI widget.
## Query Assistant
The **Assistant** tab in the right rail is a chat panel that reads your connected schemas and the code currently in the editor, then writes or fixes queries for you. The rail opens automatically the first time you open a query; if you close it, reopen it from the editor header.
### What it does
Type a request in plain English:
* *"Show me the top 10 customers by revenue in the last 90 days"*
* *"Add a filter for status = 'active'"*
* *"Rewrite this to group by month instead of day"*
* *"This query is slow — can you optimise it?"*
It also answers questions without touching your code. Asking *"what does this CTE do?"* gets an explanation, not an edit — the assistant routes your intent to writing, fixing, explaining, or summarising as appropriate.
### Reviewing changes
When the assistant modifies your query the editor switches to **diff mode**, showing your original alongside the suggestion.
* **Per-hunk** — accept or reject each changed block individually
* **All at once** — a floating bar reads *"Accept all changes?"* with **Reject all** (`⌘N` / `Ctrl+N`) and **Accept** (`⌘Y` / `Ctrl+Y`)
A single reply can propose **several** separate changes; those appear as a carousel you can page through. Both sides are formatted before diffing, so you see real hunks rather than one giant block.
You cannot type in the editor until every hunk is resolved — the assistant's input reads *"Accept or reject the change to continue…"* while a diff is open.
### Error fixing
When a query fails, the error appears in the results pane with a **"Fix this error with AI"** button. Clicking it sends the error to the assistant, which diagnoses it and suggests corrected code.
### Conversations
Assistant conversations are **saved**. The header of the assistant panel is a session switcher:
* **New conversation** starts a fresh thread
* **Recent** lists your previous threads for this query — unnamed ones show as *"Untitled session"*
Each turn carries the recent history forward, so follow-ups like *"now do the same for last quarter"* work as expected. Sessions persist across page reloads and across visits.
## History and Undo
The **History** tab in the right rail records versions of your query as you work, so you can compare and roll back.
### Versions
A version is recorded at each of these moments, and the list shows where each one came from:
| Tag | Recorded when |
| - | - |
| `load` | The query as it was when you opened it — your permanent way back to the starting point |
| `run` | You pressed **Run Query** |
| `save` | You pressed **Save** |
| `ai` | You accepted an assistant diff |
Each row shows a relative timestamp and a `+N −N` count of lines changed; the version matching the editor is labelled **Current**.
* **Hover** a version to preview it as a diff overlaid on the editor — nothing changes until you click
* **Click** a version to apply it
Up to 50 versions are kept per query. History lives in your browser session, so it survives a page reload but doesn't follow you to another device.
### Undo and redo
The header of the History panel has **Undo** and **Redo** buttons, and the standard shortcuts work anywhere on the page:
| Action | Mac | Windows / Linux |
| - | - | - |
| Undo | `⌘Z` | `Ctrl+Z` |
| Redo | `⇧⌘Z` | `Ctrl+Shift+Z` or `Ctrl+Y` |
Undo covers edits to the code itself — including applied AI diffs and history versions — not schema selections or panel state. The undo stack is also preserved across reloads, so `⌘Z` still works after you come back.
## Schema Browser
The **Schema** tab in the right rail shows the structure of every data source available to this query.
### What you can browse
* **Data sources** — expandable list of connected databases
* **Tables** — expand any database to see its tables
* **Columns** — expand any table to see its columns
### Search
Filter by resource, table, or column name using the search bar in the panel.
The schema browser reflects the same tables and columns used by autocomplete in the editor — use it as a reference while writing. After you refresh a table's schema from Data Sources, the change applies here and in autocomplete **immediately**; there is no cache to wait out.
## MongoDB Queries
For MongoDB data sources, the assistant writes real **aggregation pipelines** — a JSON array of stages, not a query string.
Two things worth knowing:
* **Read-only.** Generated pipelines never use `$out` or `$merge`.
* **Dates must be Extended JSON.** A date compared as a plain string silently matches **zero** documents rather than erroring. Generated pipelines use the `{"$date": ...}` form; if you hand-edit one, keep it.
Mongo pipelines are validated by actually running them before the assistant shows you the result.
## Python and Multi-Source Queries
> **Feature-gated.** Python and multi-source selection require the Python runner feature. Without it, the language dropdown disables Python and the data-source picker caps you at one source. See [pricing](https://supaboard.ai/pricing).
### Python as the query language
Write Python instead of SQL when you need to:
* Transform or reshape data after retrieval
* Combine results from multiple sources with logic that's awkward in SQL
* Run calculations that are difficult to express in SQL
The editor loads a full Python language mode, and tab completion switches to a Python-aware model.
#### The runtime contract
Python queries run in a constrained sandbox, and generated code follows the same rules:
| Rule | Detail |
| - | - |
| **Connection** | A single `Connection` object is provided |
| **Querying** | `conn.run(...)` returns a list of dicts |
| **Allowed** | `numpy` |
| **Not allowed** | `try` / `except` / `finally`; Pydantic, Query or Data classes; direct database drivers such as `pymongo` or `asyncpg` |
Python snippets are not execution-validated before they are shown to you, so run them yourself before saving.
### Multi-source queries
Select more than one data source when creating a query. Multi-source is **Python only** — Python is the glue that joins or merges data across separate databases.
## Pinning Results to a Dashboard
Any result — table, chart, or KPI — can be pinned directly from the results pane.
Click **Pin to Dashboard** above the results, then select an existing dashboard or create one inline. The widget is added immediately and re-runs the underlying query on every dashboard load.
Pinned widgets keep their full configuration — query code, data source mapping, chart type, KPI display style — so they stay accurate as your data changes.
## Managing Saved Queries
### Rename
Either from the Query Bench home — action menu (three dots) → **Rename** — or inline from **Editor settings → Title** while the query is open.
### Delete
Action menu → **Delete**. A confirmation is required. Deleting a query does not remove dashboard widgets pinned from it — those keep working independently.
### Returning to a query
Click any query from the home list. The last saved code, output format, and assistant conversations are all restored.
## Permissions
Query Bench feature access, data source access, and the saved query's sharing settings all apply.
| Access | What it allows |
| - | - |
| **Can view** | Run the saved query, inspect its results, and set variables for your own run |
| **Can edit** | Also change its query and variables, manually or with the Assistant |
| **Owner** | Also rename, share, or delete the query |
Changes require an editing role in the workspace. Python and multi-source queries also require the corresponding feature. Pinning a result requires permission to add content to the destination.
## Next steps
[Create a query](/query-bench/create-and-save-a-query) or explore [SQL examples](/query-bench/writing-sql-queries).
This documentation is built and hosted on [Mintlify](https://mintlify.com), a developer documentation platform.