

Before you begin
Ask the Analyst a question using an agent with access to the relevant data. Include any specific definition or comparison you have in mind.Read the answer
- Check the scope: the date range, filters, and groups included.
- Check the meaning: what counts as revenue, an active customer, or another business metric.
- Open the supporting chart or table to examine the numbers.
- Look for assumptions and missing information before acting on the result.
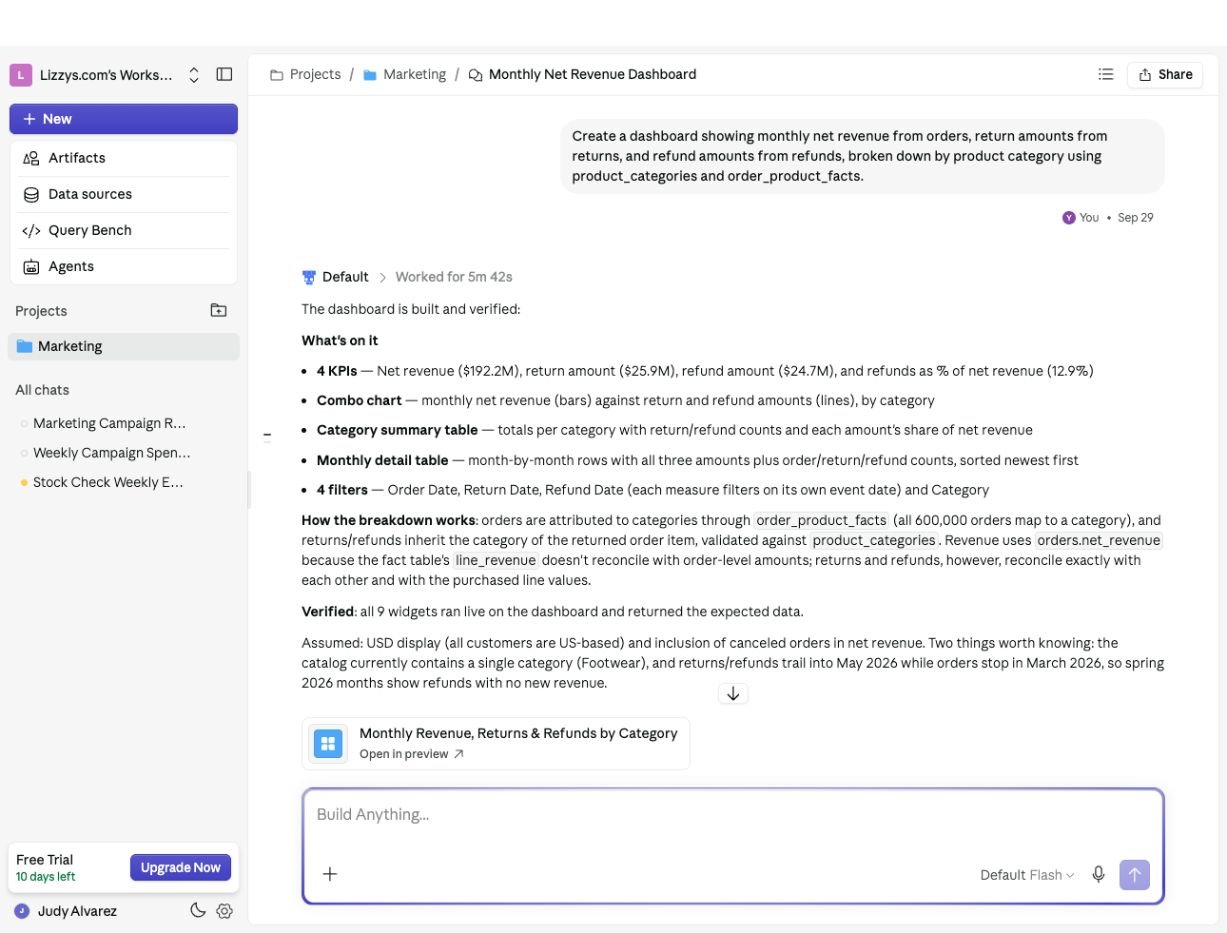
Check the explanation and its assumptions, then open the artifact card to inspect the result.
Choose the right depth
The current modes are Flash, Pro, and Max. Flash suits everyday questions; Pro supports deeper analysis; Max plans before investigating complex tasks. Older guides refer to Concise and Deep Dive. Request the detail you need in any mode: “Give me three key findings” or “Explain the drivers and show the supporting breakdowns.” A shorter explanation still needs the right data and definitions.Work with the result
- Open a visual or artifact for a closer look.
- Use a widget’s ⋯ menu for actions such as downloading an image or exporting a table as CSV.
- Use Pin to reuse a widget in a dashboard or Datasite.
- Ask for a change in the same chat: “Use a line chart” or “Add a breakdown by channel.”