

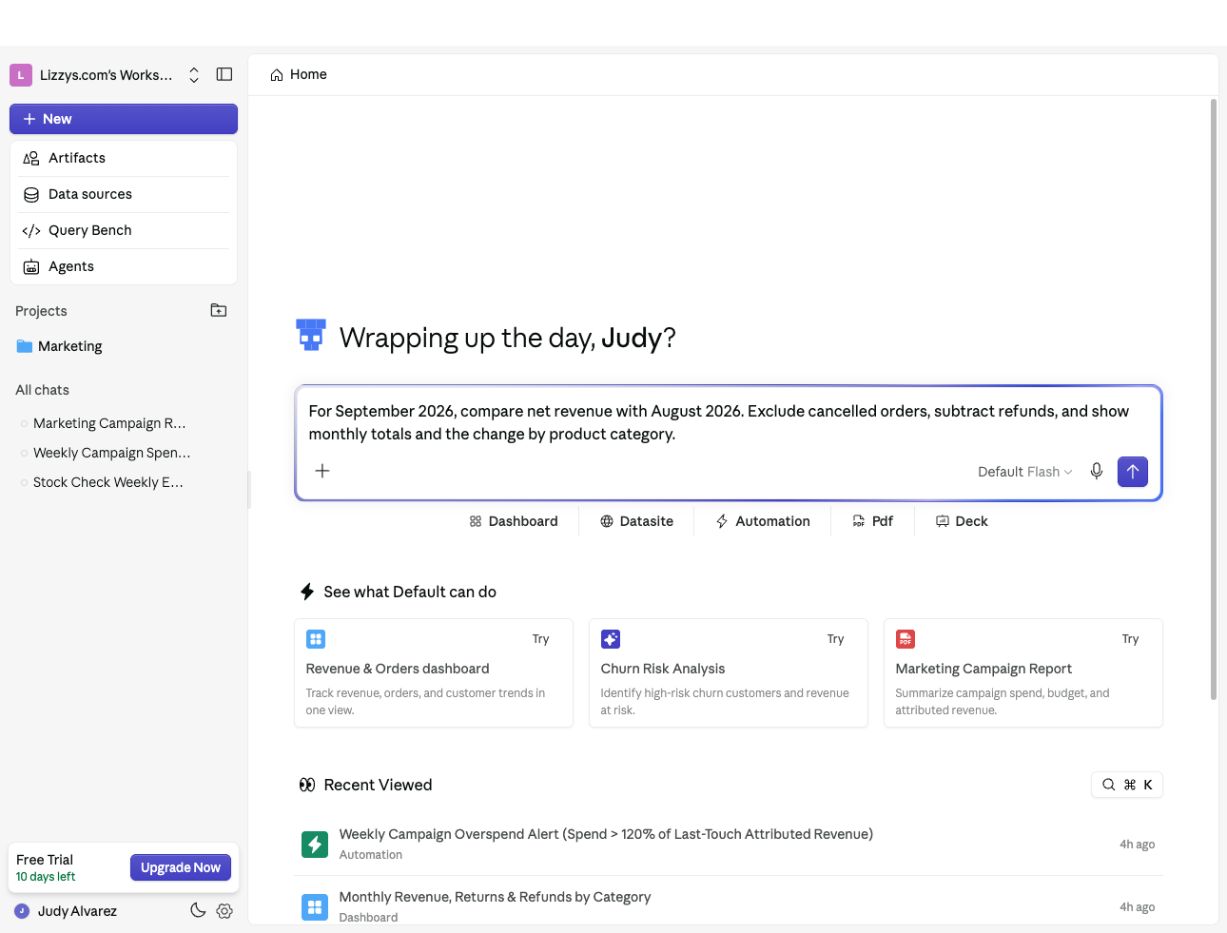
Most bad AI answers trace back to a prompt that left something open: no timeframe, no definition of the metric, or three questions bundled into one. The agent fills those gaps with guesses, and its guess may not match what you meant. The fix is mechanical. A prompt that works pins down: Say when, say what to calculate, and ask for the totals behind the result. That covers most of it. Things to avoid are the mirror image: no timeframe, several KPIs in one prompt, undefined metrics, subjective wording (“how well”, “why is it high”).
An unsent Analyst prompt comparing September and August net revenue, excluding cancelled orders, subtracting refunds, and grouping by product category

Before sending, name the period, define the metric, and ask for a useful breakdown. This example is an unsent draft.

Before and after

The examples below are drawn from real failure patterns. In each one the vague version isn’t wrong, exactly — it’s underspecified, and the answer suffers in a predictable way.

Counting a problem instead of costing it

Show the number of failed transactions this month.

You’ll get a count. But if what you actually care about is the money, the count doesn’t tell you — and “this month” may be interpreted as calendar month or last 30 days.

For March, calculate the total value of failed transactions. Include both the number of failed transactions and the total value affected.

Comparisons with no anchor

How did this month perform compared to last month?

“Perform” on what metric? Which months, exactly? Name the metric and the months, and ask for the difference to be explained:

Give me total revenue and total payments for March and April. Compare the two months and explain the percentage difference.

Rates with an unclear denominator

What percentage of submissions failed?

Failed out of what? All submissions ever? First attempts only? Every rate needs its numerator and denominator spelled out, plus a timeframe:

Out of all submissions in the last 90 days, what percentage failed on the first attempt? Give me total submissions and total failed submissions too.

The same applies to resolution rates, conversion rates, and anything else expressed as a percentage. If timing matters, say which date anchors the calculation — “use the issue creation date as the reference point” removes a whole class of ambiguity.

”Why” questions with no breakdown

Why is the outstanding balance high?

“High” is subjective, and a why-question with no structure invites a subjective answer. Turn it into a measurement with a breakdown, and the “why” tends to fall out of the numbers:

What's the total balance older than 90 days? Break it down by category and by account owner.

Contribution questions work the same way — instead of “how much revenue came from customers?”, ask for the amount and the percentage of the total it represents, for a named period. Without the reference total, a raw number floats free.

A template, if you want one

For [timeframe], calculate [metric]. Include [the supporting totals], broken down by [dimension] if needed.

Fill in the brackets and delete what you don’t need. One metric per prompt — if you want five KPIs, five short prompts beat one long one.
Last modified on October 2, 2026