

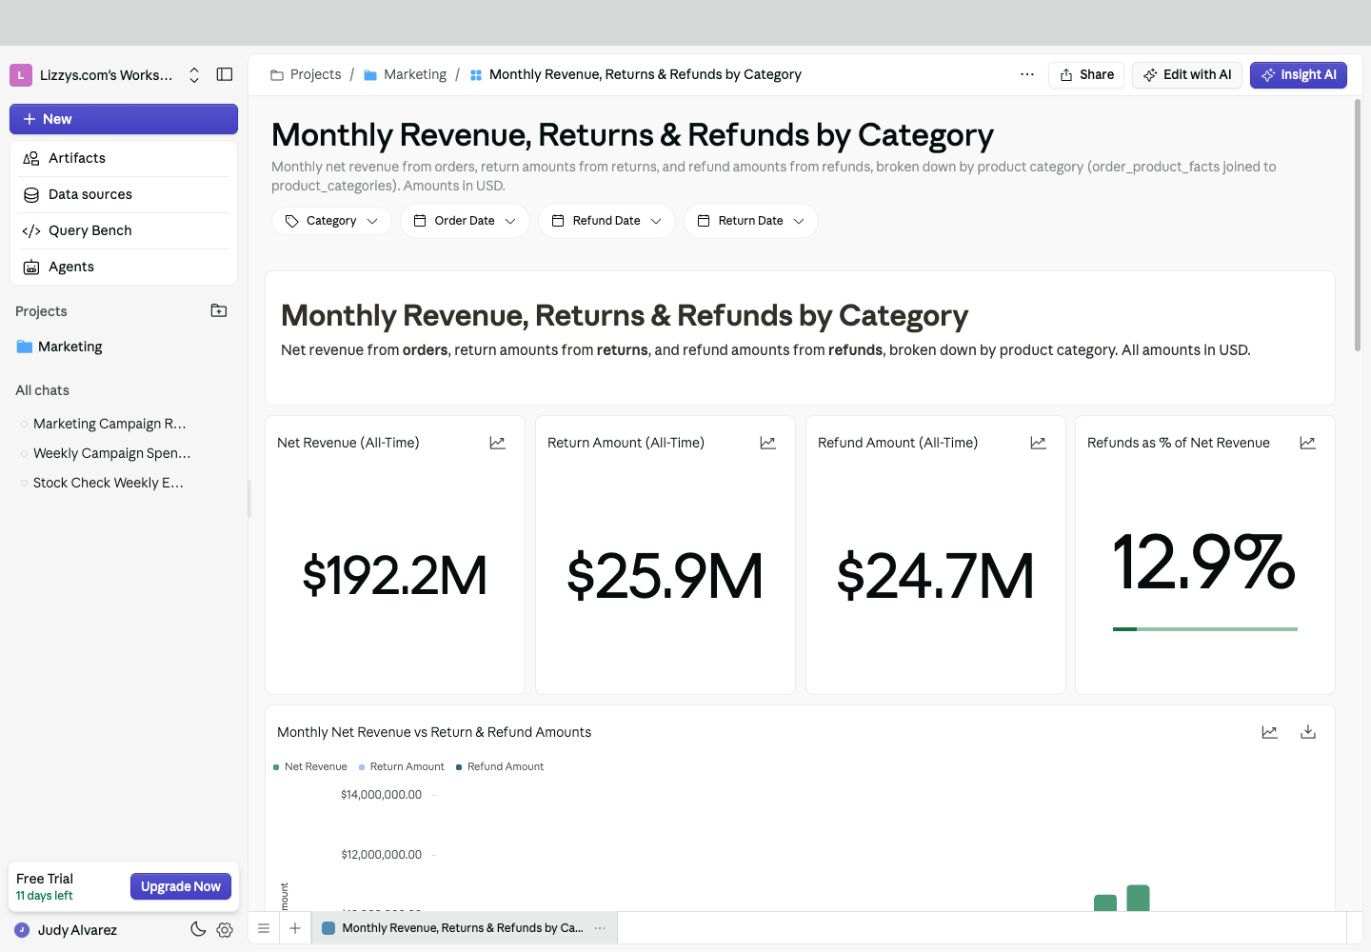
Dashboard filters and headline metrics give readers a starting point for their investigation.
How-to guides
Create a dashboard
Describe the result, check the numbers, and refine the layout.
Add widgets and edit
Add charts, tables, and KPIs, then save your changes.
Add filters
Choose the source columns each control should affect.
Investigate a number
Use records, drill-through, and Insight AI.
Share a dashboard
Choose who can view, chat, edit, or add content.
Export or report
Download a snapshot, create a report, or schedule delivery.
Organisation — Groups and Dashboards
Dashboards are always nested inside a Dashboard Group.Creating a Dashboard Group
Open Artifacts → Dashboards to find existing dashboards. To create one, select New Artifact → Dashboard, enter a name, and optionally choose a project.- Build Manually creates the dashboard group and opens its editor.
- Build with AI also needs a description. It opens the Analyst with your brief so you can build through chat.
Building a Dashboard With AI
Describe what you want
Start from Home → Dashboard, New Artifact, or an existing Analyst chat. Describe the audience, metrics, time period, and any filters: “Build a weekly sales dashboard with revenue, order count, and a region filter.”Review the plan
Answer any clarifying questions, then open the dashboard card in the chat to inspect the result. Request changes in the same conversation. The Analyst can update widgets, filters, layout, and dashboard pages.Or build it yourself
Choose Build Manually, then use the dashboard’s edit controls to add charts, tables, KPIs, text, images, and embeds. The sections below explain these controls.Edit Mode vs View Mode
View mode
The default for readers. Viewers can:- Interact with charts (hover tooltips, right-click to drill through)
- Apply dashboard filters
- Scroll and read all widget content
- Export widgets
- Open Insight AI if you have Can chat access
Edit mode
Select More options → Edit manually. Can edit access lets you change existing content; Can create also lets you add widgets and pages. An editing role in the workspace is required for changes. Depending on your access, you can:- Add, move, resize, and delete widgets
- Configure widget data and visualisation
- Change dashboard settings
- Undo and redo layout changes
The toolbar
View mode offers More options, Share, Edit with AI, and Insight AI, depending on your access. Manual editing is inside More options. Edit mode replaces them with:Saving is explicit
Edits are not saved as you go. Nothing is persisted until you click Save. Navigating away with unsaved work raises an Unsaved Changes dialog — “You have unsaved dashboard changes. Would you like to save them before leaving?” — with Discard and Leave and Save and Leave.Undo and redo
History is kept for the current browser session, up to 30 steps, and survives a page refresh mid-edit.
The keyboard shortcuts require the Command key. On Windows and Linux, Ctrl+Z does nothing here — use the Undo and Redo buttons in the toolbar.
Adding Widgets
In edit mode a floating toolbar sits at the bottom-centre of the canvas. Drag it anywhere; double-click to snap it back.Data widgets are a two-step flow
Picture, Embed, Filter, and Text insert immediately. KPI, Table, and Chart insert a placeholder that asks how you want to fill it:
This means you never have to leave the dashboard to build a widget, and anything you built in the Analyst or Query Bench is one click from the canvas.
Widget Types
Chart
An interactive chart for comparing values or showing a trend. Configure the data source, axes, chart type, colours, legend, and labels from the visualisation panel — see Chart Widget. In view mode: hover for tooltips, right-click to drill. Export: PNG, via an icon in the widget header.KPI
A single computed metric. Four types — number, percentage, trend, and comparison — determined by the query and analysis behind it. Formatting is configured in the Edit KPI panel; see KPI Widget.Table
Query results in a paginated, scrollable grid, with column grouping, aggregate footers, conditional formatting, pivots, and click-to-filter. See Table Widget. Export: CSV, with a choice of all data, the current page, or a row range.Filter
An interactive control that filters every compatible widget at once, without entering edit mode. Filter widgets appear in a sticky bar at the top of the dashboard, not in the grid.Text, Image, and Embed
Text is a full rich-text editor — bold, italic, underline, strikethrough, headings, alignment, colours, links, and emoji. Image uploads a file that scales to its grid cell. Embed displays content from a URL that permits embedding.Filters
Filters operate at two levels.Widget-level filters
Configured inside an individual widget’s data settings. Fixed — viewers cannot change them. Use these to permanently scope a widget, e.g. “always show only the last 30 days”.Dashboard filters
Added to the canvas as a Filter widget. Viewers change these in view mode and every compatible widget updates.Filter types
Date presets
Date filters offer 13 presets, grouped:
Plus Relative date range…, which opens a builder: a direction (Previous or Next), a quantity, and a unit (Days, Weeks, Months, Years). Use it for windows the presets don’t cover — “previous 45 days”, “next 2 quarters”.
Cascading filters
Category filters, and String filters using the Category Style (In) operator, offer Cascade Suggestions based on other filters. With it on, the filter’s suggestions narrow to values that actually exist under the filters already applied — pick a country, and the city list shrinks to that country’s cities.Cascading depends on the connector pushing the search into the database. On connectors that can’t, the suggestion list stays unfiltered. See Data Sources.
Widget Operations
From the widget header menu (the three-dot icon revealed on hover):In edit mode
Resizing and moving
- Move — drag the widget by the handle on its left edge. Dragging the header does not move it.
- Resize — drag the bottom-right corner.
Drilling Into Data
Right-click any chart data point or table cell to open the widget menu:
Drill Through opens a Drill by submenu offering Category or Time, then the specific columns available from each table in the query.
The drill view has a breadcrumb of steps so you can see the path you took and step back up it, plus date range controls for time-series drilling. Dashboard filters are carried into the drilled view, so you’re always drilling the slice you were looking at.
Records is available on KPI widgets; Drill Through is not. A KPI is already a single aggregate, so there’s no dimension left to break out — but you can still see the rows behind the number.Left-clicking a table cell does something different: it filters the dashboard by that value.
Click-to-filter
On tables with Click Behaviour enabled, left-clicking a cell pushes its value into any matching dashboard filter and highlights the row. Columns need to be mapped to their underlying source for this to work — see Table Widget.Dashboard Settings
In edit mode, click Settings to open the Dashboard Settings panel. Everything here applies to the whole dashboard.Environments
An environment remaps which resource and database a dashboard’s widgets query, without touching the widgets themselves. The usual case is one dashboard serving staging and production, or the same dashboard pointed at different customers’ databases. Manage them from Settings → Environment, where you can create environments and map each widget’s tables to the target source. Switching environments needs no rebuild — the widgets are unchanged; only where they read from moves. Embedded dashboards can be pinned to an environment per link — see Embed URL parameters.The Share Menu
Click More options (⋯) in the view-mode toolbar. Some actions require ownership or additional access.Take a Snapshot
A one-click PDF export. Supaboard shows “Preparing snapshot…”, then “Snapshot ready” with a Download action. Whatever filters you currently have applied are captured in the snapshot. Use this when you want the dashboard exactly as it is. Use Reports when you want an AI-written narrative around the data.Reports
Open Reports, then select New Report:
Past reports are listed in the panel — click any entry to download it again.
Email Reports
Schedule a recurring report to a list of recipients.This builds a real automation behind the scenes. You can open it in the Automations editor afterwards to add steps, change the trigger, or branch on a condition.
Access Control
Access is set for the dashboard group and applies to its pages. The owner can select Share to review people, inherited project access, and general access.
Changing content also requires an editing role in the workspace. Only the owner can manage sharing, delete the group, or manage its embeds. See Share a dashboard for the full workflow.
Insight AI
Click Insight AI in the toolbar to open a chat panel beside the dashboard. Ask questions about what you’re looking at — “why did revenue drop in March?” — and the agent answers using the dashboard’s widget data. If a question can’t be answered from the existing widgets — “break this down by company” — the agent falls back to running a live query against your connected database rather than giving up. It still prefers your existing widgets whenever they cover the question. The agent used is set in Settings → Default Agent.Dashboard Tabs (Multi-page)
Multiple dashboards in a group appear as tabs at the bottom of the screen.
Rename and delete work in view mode as well as edit mode. The last remaining dashboard in a group cannot be deleted.
Duplicating a Dashboard Group
From the dashboard card in Artifacts → Dashboards, open the action menu and select Duplicate. The modal lets you remap data sources — point the copy at a different connection from the original. Useful for environment-specific or client-specific copies. The duplicate is named with ” Copy” appended and contains every dashboard, widget, and layout setting from the original.For switching data sources on an existing dashboard rather than a copy, use Environments instead — no duplication needed.