

Before you begin
- Your workspace needs a connected data source.
- Choose an agent that can read the relevant tables and understands your business definitions.
- You need permission to create dashboards. Adding to an existing dashboard needs Can create access and an editing role in the workspace.
Start with a clear brief
- Open Artifacts in the sidebar and select New Artifact.
- Choose Dashboard and enter a name people will recognize.
- Describe the audience, metrics, period, and filters. Choose a project if the dashboard belongs with other work.
- Select Build with AI to continue in the Analyst.
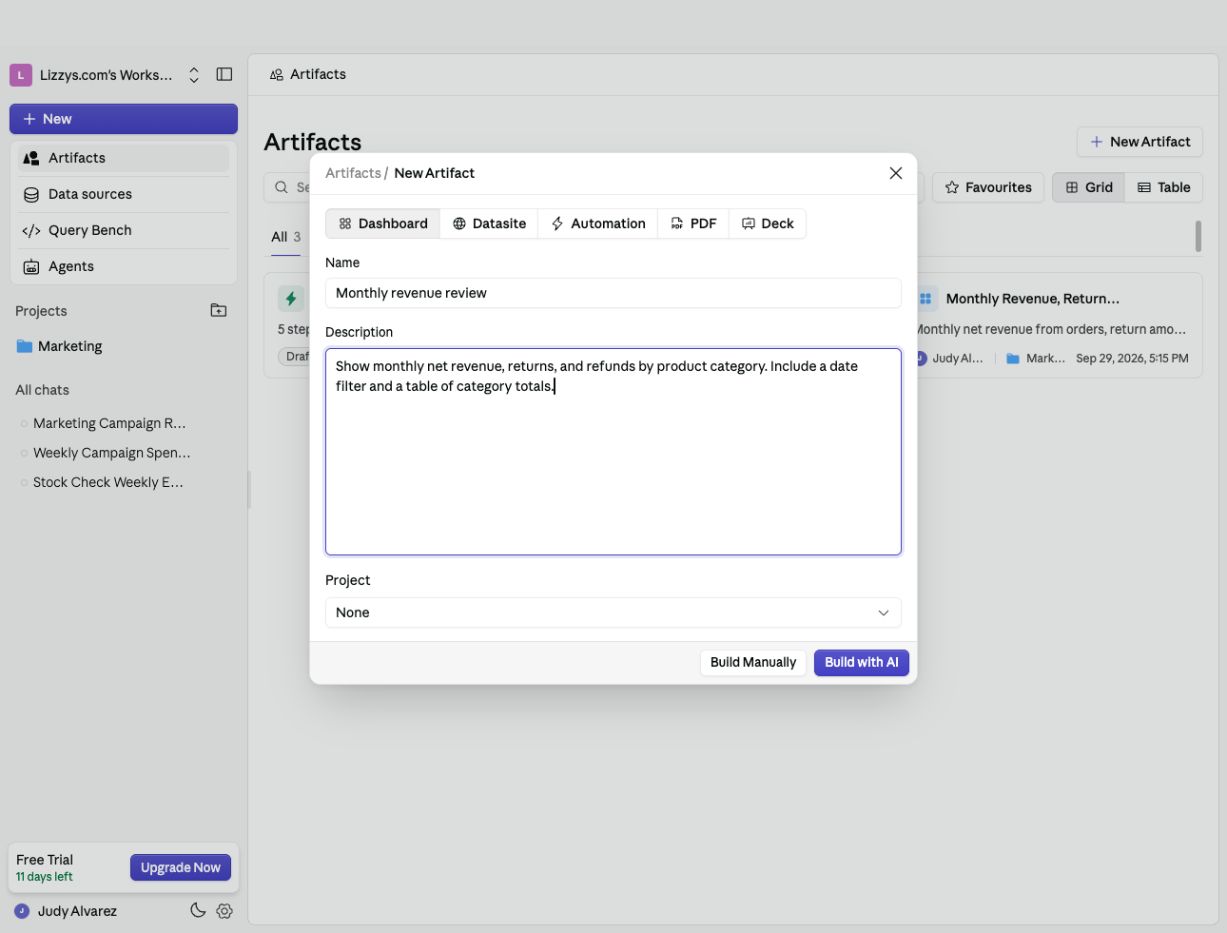
Choose Dashboard, give it a name, and describe the result before opening the Analyst.
A starting brief for a revenue dashboard
Review the result
Open the dashboard card in the conversation. Check one part at a time:- Definitions: does revenue include discounts, canceled orders, or refunds?
- Dates: does each metric use the intended event date?
- Totals: do the headline numbers agree with the supporting tables?
- Filters: does changing a value affect the intended widgets?
- Readability: can a teammate understand the page without reading the chat?
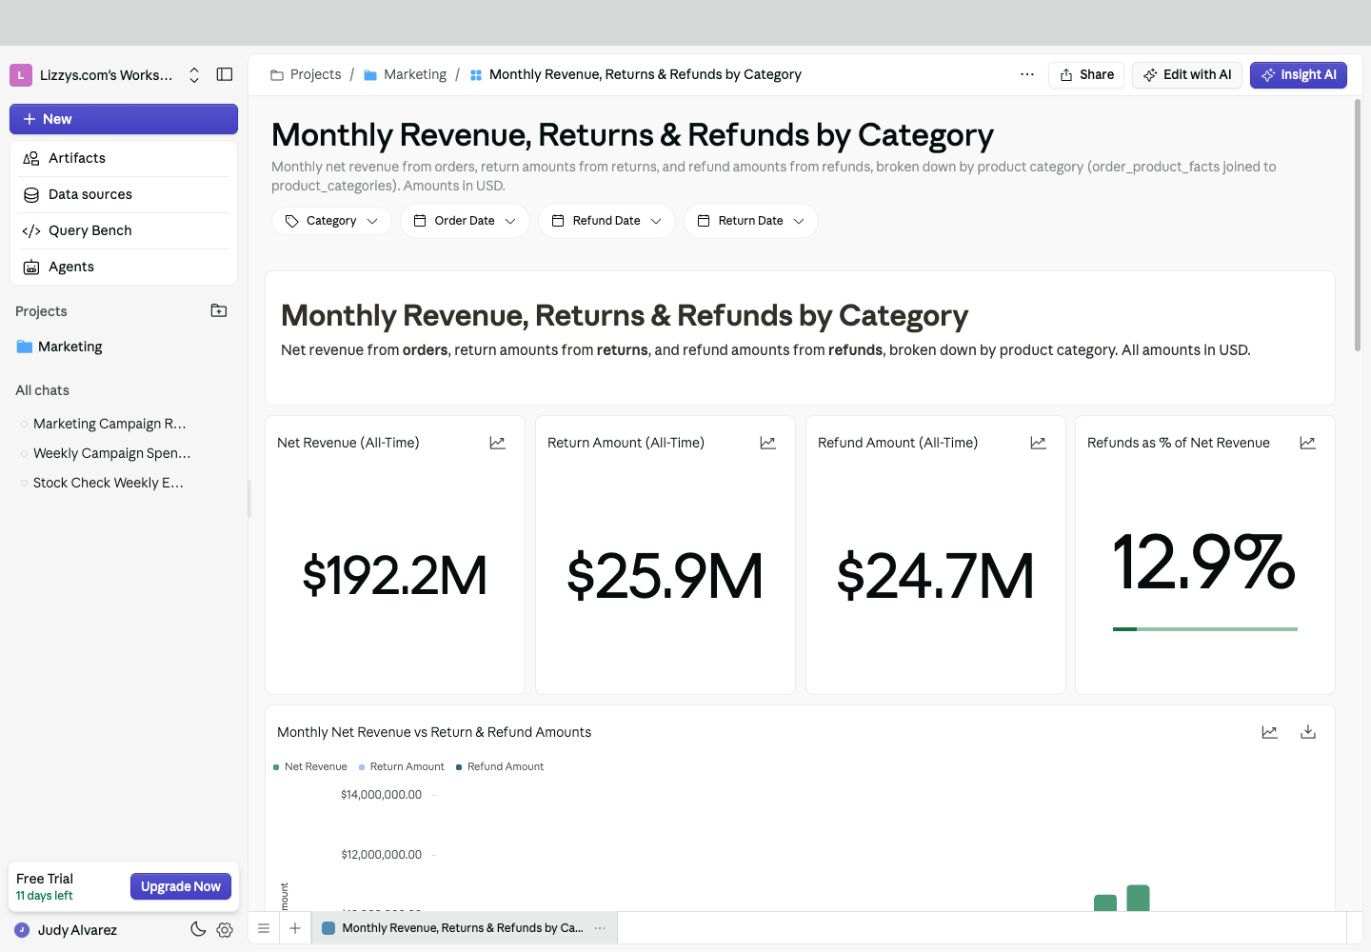
A finished dashboard combines headline metrics, filters, and supporting detail.