

Before you begin
Open the intended dashboard page and check the data, period, and filters. Generating an AI report requires Can chat access or higher. Available actions also depend on your workspace permissions.Choose the output
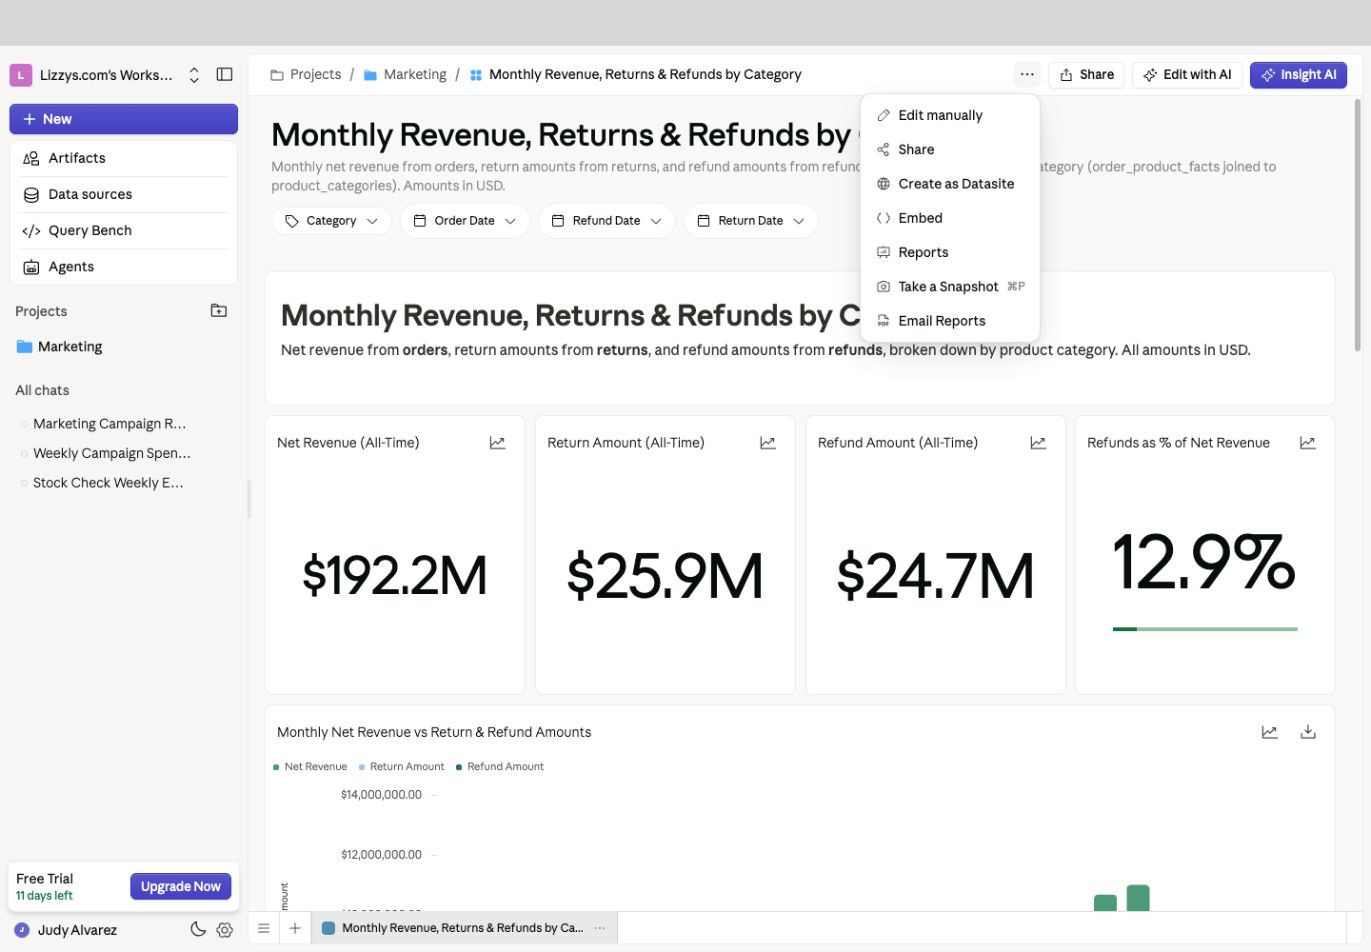
Dashboard export and report actions live in More options.
Take a snapshot
- Set the dashboard filters to the view you want to share.
- Select More options → Take a Snapshot.
- Wait for the snapshot to finish, then choose Download.
- Open the PDF and check that the intended page and data slice were captured.
Create an AI report
- Select More options → Reports, then New Report.
- Choose the dashboard page and enter a Report Title.
- Choose PDF or PPT in Report Type.
- Review Filters in the report form. Set the intended data slice explicitly.
- Use Custom Instruction for AI to describe the audience, questions, and structure.
- Optionally use Advanced Settings for page-by-page guidance.
- Select Create Report, wait for generation, then open and review the file.
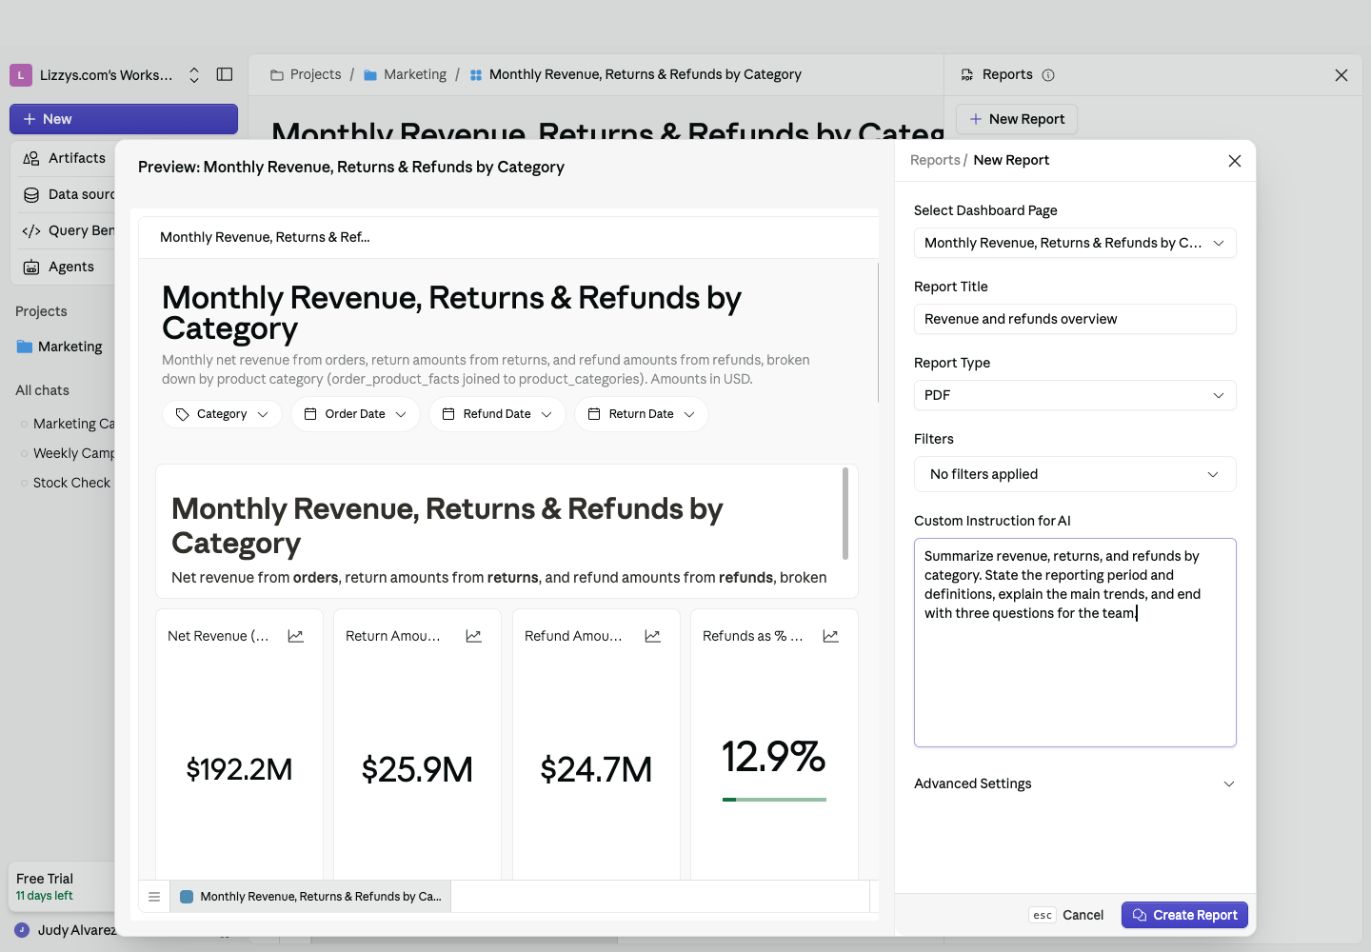
The report form combines a dashboard preview with the title, format, filters, and writing brief.