

Before you begin
Open the dashboard from Artifacts → Dashboards. You need Can edit access to change existing content or Can create to add widgets and pages. Changes also require an editing role in the workspace.Edit with AI
Select Edit with AI at the top of the dashboard. The dashboard opens alongside an Analyst conversation. Describe the change and review the result in the preview. Be specific: “Keep the existing charts, add a KPI for completed orders, and put it beside net revenue.” For questions about the current numbers, use Insight AI.Open the manual editor
- Open More options (⋯) at the top of the dashboard.
- Select Edit manually.
- The toolbar changes to Undo, Redo, Settings, Cancel, and Save. The insert toolbar appears near the bottom of the canvas.
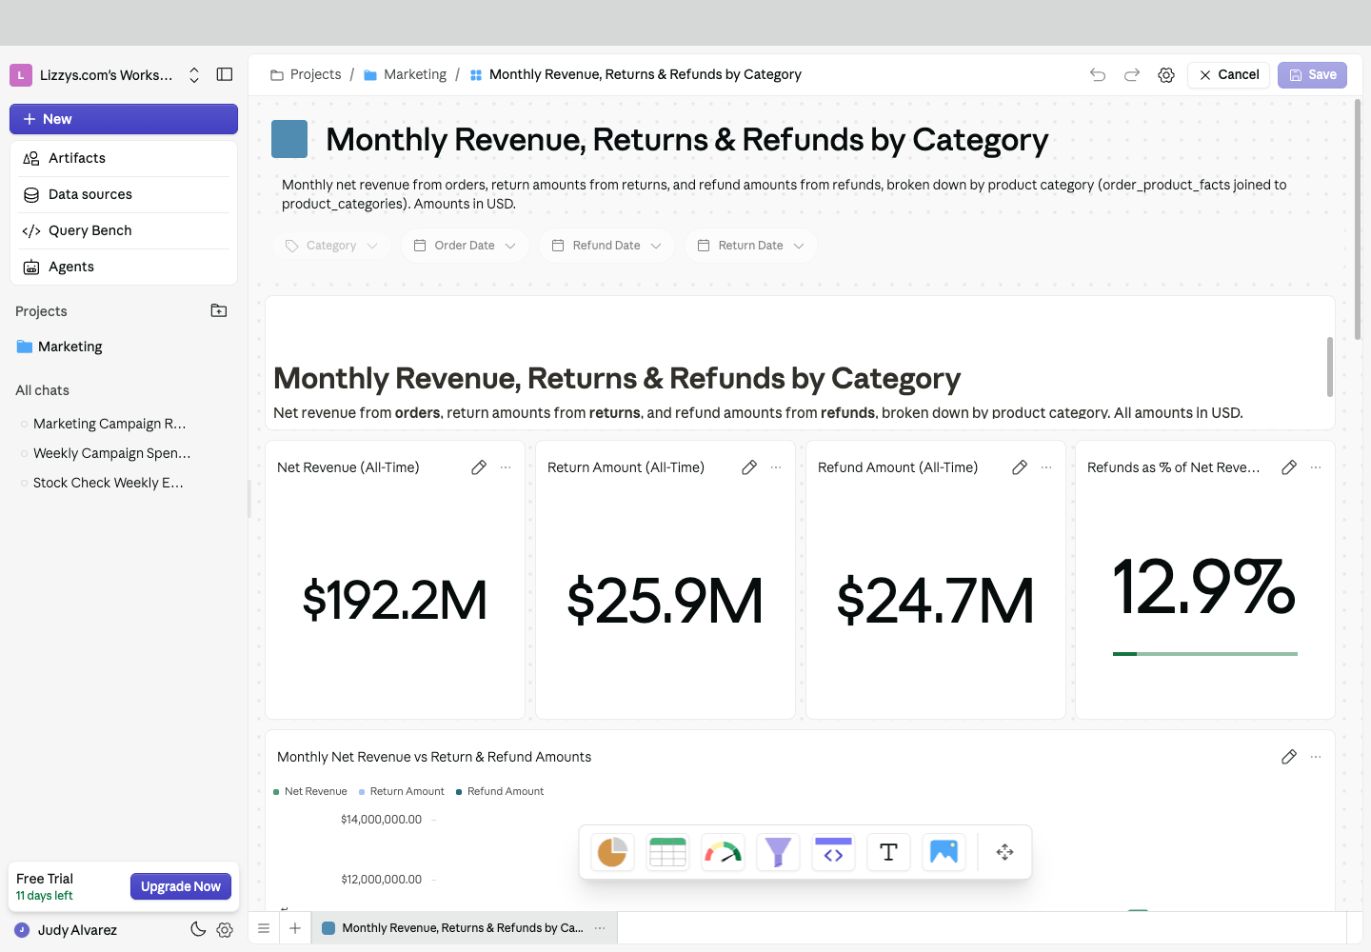
Manual editing exposes widget settings and the insert toolbar. Save is in the top-right corner.
Add a widget
Choose an insert control in the bottom toolbar. Hover over an icon to see its name.
For a chart, table, or KPI, the placeholder lets you select an existing result from a collection or create one using a prompt. Choose the result that already has the right calculation; changing its appearance does not change what the metric means.
Arrange and format
- Drag the widget’s move handle on its left edge to reposition it.
- Drag its resize handle to change its size.
- Use the widget’s pencil or settings control to change its chart, table, or KPI formatting.
- Use the widget’s ⋯ menu for actions such as changing its colors, hiding its header, moving it to another page, or removing it.
- Use the dashboard’s Settings for shared colors, fonts, spacing, and other page settings.
Save and check
- Apply changes in any open widget settings panel.
- Select Save in the dashboard toolbar to save the dashboard edits.
- Check the result in view mode, including filters and any resized tables.